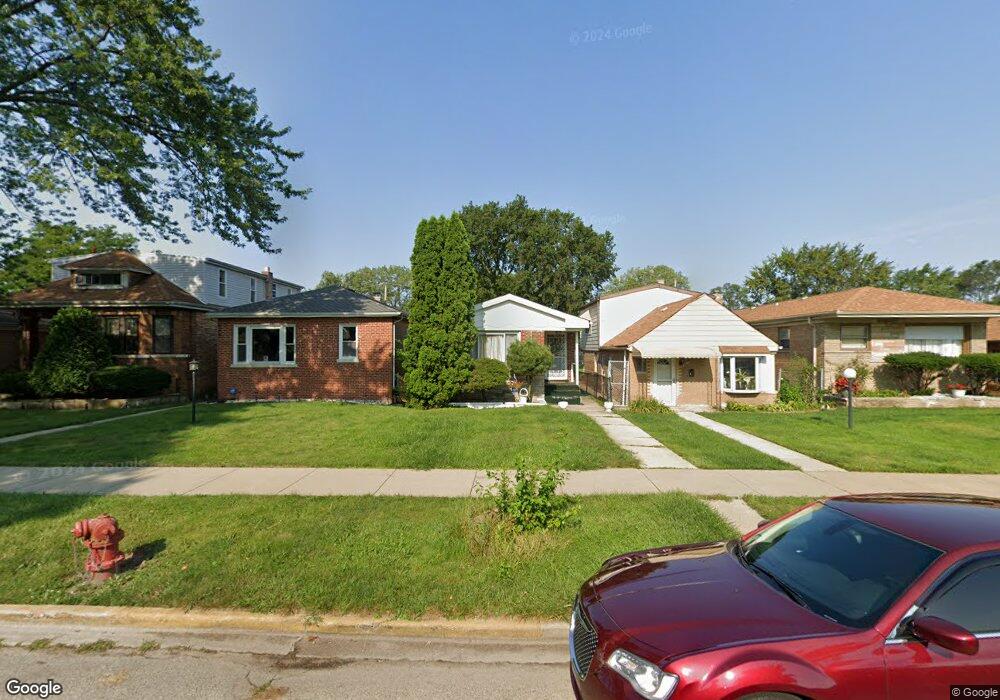
9626 S Harvard Ave Chicago, IL 60628
Roseland NeighborhoodEstimated Value: $188,718 - $200,000
3
Beds
1
Bath
1,033
Sq Ft
$187/Sq Ft
Est. Value
About This Home
This home is located at 9626 S Harvard Ave, Chicago, IL 60628 and is currently estimated at $193,680, approximately $187 per square foot. 9626 S Harvard Ave is a home located in Cook County with nearby schools including Gillespie Elementary School, Harlan Community Academy High School, and Christian S T E M Scholars.
Ownership History
Date
Name
Owned For
Owner Type
Purchase Details
Closed on
Nov 8, 1999
Sold by
Bruzys Sigitas
Bought by
Ogeese Debra and Ogeese Johnny
Current Estimated Value
Home Financials for this Owner
Home Financials are based on the most recent Mortgage that was taken out on this home.
Original Mortgage
$94,325
Outstanding Balance
$28,730
Interest Rate
7.72%
Mortgage Type
FHA
Estimated Equity
$164,950
Purchase Details
Closed on
May 18, 1999
Sold by
Aames Capital Corp
Bought by
Bruzys Sigitas
Purchase Details
Closed on
Dec 6, 1995
Sold by
Transamerica Financial Services Inc
Bought by
Foster Thyra
Purchase Details
Closed on
Oct 1, 1995
Sold by
Foster Thyra A
Bought by
Foster Tanya A
Home Financials for this Owner
Home Financials are based on the most recent Mortgage that was taken out on this home.
Original Mortgage
$61,600
Interest Rate
10.62%
Purchase Details
Closed on
Sep 22, 1993
Sold by
Sheahan Michael F
Bought by
Aetna Finance Company and Itt Financial Services
Create a Home Valuation Report for This Property
The Home Valuation Report is an in-depth analysis detailing your home's value as well as a comparison with similar homes in the area
Home Values in the Area
Average Home Value in this Area
Purchase History
| Date | Buyer | Sale Price | Title Company |
|---|---|---|---|
| Ogeese Debra | $94,500 | -- | |
| Bruzys Sigitas | $53,500 | -- | |
| Foster Thyra | -- | -- | |
| Transamerica Financial Services Inc | -- | -- | |
| Foster Tanya A | -- | -- | |
| Foster Tanya A | -- | -- | |
| Aetna Finance Company | -- | -- |
Source: Public Records
Mortgage History
| Date | Status | Borrower | Loan Amount |
|---|---|---|---|
| Open | Ogeese Debra | $94,325 | |
| Previous Owner | Foster Tanya A | $61,600 |
Source: Public Records
Tax History Compared to Growth
Tax History
| Year | Tax Paid | Tax Assessment Tax Assessment Total Assessment is a certain percentage of the fair market value that is determined by local assessors to be the total taxable value of land and additions on the property. | Land | Improvement |
|---|---|---|---|---|
| 2024 | $1,347 | $13,000 | $5,286 | $7,714 |
| 2023 | $1,271 | $13,000 | $4,173 | $8,827 |
| 2022 | $1,271 | $13,000 | $4,173 | $8,827 |
| 2021 | $1,278 | $13,000 | $4,173 | $8,827 |
| 2020 | $2,169 | $12,817 | $4,173 | $8,644 |
| 2019 | $2,146 | $14,085 | $4,173 | $9,912 |
| 2018 | $2,109 | $14,085 | $4,173 | $9,912 |
| 2017 | $2,204 | $13,591 | $3,616 | $9,975 |
| 2016 | $2,227 | $13,591 | $3,616 | $9,975 |
| 2015 | $2,015 | $13,591 | $3,616 | $9,975 |
| 2014 | $1,924 | $12,915 | $3,338 | $9,577 |
| 2013 | $1,875 | $12,915 | $3,338 | $9,577 |
Source: Public Records
Map
Nearby Homes
- 9606 S Eggleston Ave
- 9630 S Yale Ave
- 9632 S Yale Ave
- 9747 S Harvard Ave
- 520 W 97th St
- 422 W 98th Place
- 9745 S Wentworth Ave
- 9610 S Wallace St
- 549 W 95th St
- 9521 S La Salle St
- 9407 S Normal Ave
- 9647 S Lowe Ave
- 9430 S Parnell Ave
- 9741 S Lowe Ave
- 9351 S Normal Ave
- 400 W 99th Place
- 608 W 95th St
- 9310 S Eggleston Ave
- 9919 S Wentworth Ave
- 9328 S Parnell Ave
- 9624 S Harvard Ave
- 9628 S Harvard Ave
- 9622 S Harvard Ave
- 9632 S Harvard Ave
- 9618 S Harvard Ave
- 9634 S Harvard Ave
- 9616 S Harvard Ave
- 9638 S Harvard Ave
- 9614 S Harvard Ave
- 9642 S Harvard Ave
- 9610 S Harvard Ave
- 9627 S Harvard Ave
- 9625 S Harvard Ave
- 9631 S Harvard Ave
- 343 W 96th St
- 345 W 96th St
- 339 W 96th St
- 349 W 96th St
- 9623 S Harvard Ave
- 9619 S Harvard Ave