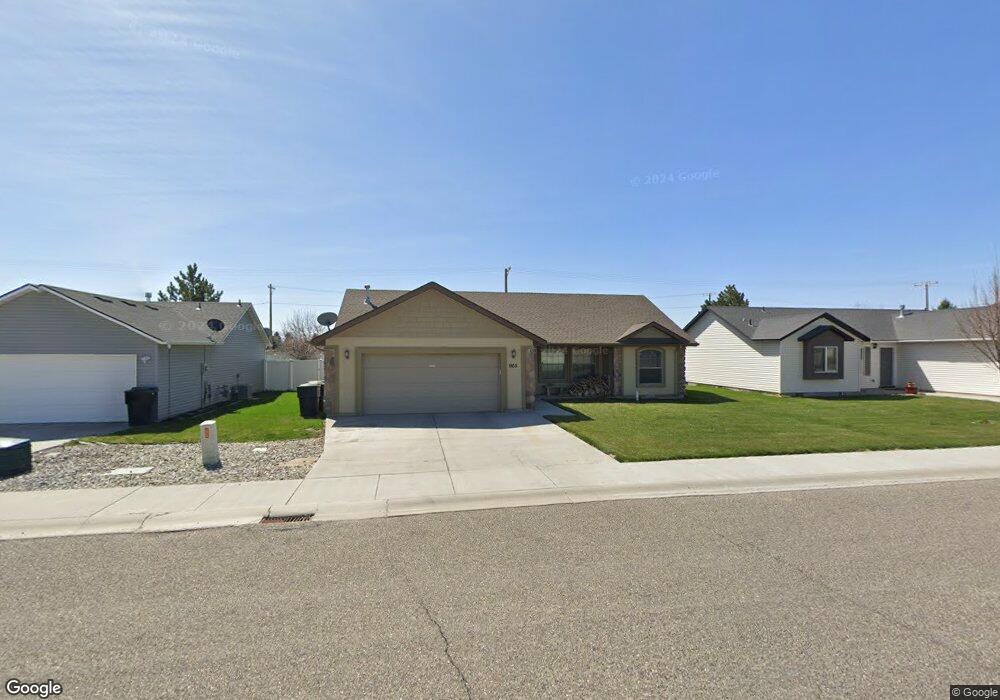
965 Zion St Burley, ID 83318
Estimated Value: $314,000 - $326,000
3
Beds
2
Baths
1,448
Sq Ft
$220/Sq Ft
Est. Value
About This Home
This home is located at 965 Zion St, Burley, ID 83318 and is currently estimated at $317,998, approximately $219 per square foot. 965 Zion St is a home located in Cassia County with nearby schools including Mountain View Elementary School, White Pine Elementary School, and Burley Junior High School.
Ownership History
Date
Name
Owned For
Owner Type
Purchase Details
Closed on
Nov 17, 2009
Sold by
Goodwin Raunda L and Goodwin Steven M
Bought by
Goodwin Steven M
Current Estimated Value
Home Financials for this Owner
Home Financials are based on the most recent Mortgage that was taken out on this home.
Original Mortgage
$148,265
Outstanding Balance
$96,414
Interest Rate
4.92%
Mortgage Type
FHA
Estimated Equity
$221,584
Purchase Details
Closed on
Oct 28, 2009
Sold by
Glacier Park Development Llc
Bought by
James Ray Inc
Home Financials for this Owner
Home Financials are based on the most recent Mortgage that was taken out on this home.
Original Mortgage
$148,265
Outstanding Balance
$96,414
Interest Rate
4.92%
Mortgage Type
FHA
Estimated Equity
$221,584
Create a Home Valuation Report for This Property
The Home Valuation Report is an in-depth analysis detailing your home's value as well as a comparison with similar homes in the area
Home Values in the Area
Average Home Value in this Area
Purchase History
| Date | Buyer | Sale Price | Title Company |
|---|---|---|---|
| Goodwin Steven M | -- | First American Title Compa | |
| Goodwin Steven M | -- | First American Title Compa | |
| James Ray Inc | -- | First American Title Compa |
Source: Public Records
Mortgage History
| Date | Status | Borrower | Loan Amount |
|---|---|---|---|
| Open | Goodwin Steven M | $148,265 |
Source: Public Records
Tax History Compared to Growth
Tax History
| Year | Tax Paid | Tax Assessment Tax Assessment Total Assessment is a certain percentage of the fair market value that is determined by local assessors to be the total taxable value of land and additions on the property. | Land | Improvement |
|---|---|---|---|---|
| 2024 | $1,207 | $309,024 | $74,950 | $234,074 |
| 2023 | $1,557 | $309,024 | $74,950 | $234,074 |
| 2022 | $1,440 | $258,328 | $59,960 | $198,368 |
| 2021 | $1,427 | $203,507 | $44,415 | $159,092 |
| 2020 | $1,378 | $178,843 | $42,325 | $136,518 |
| 2019 | $1,342 | $171,912 | $39,930 | $131,982 |
| 2017 | $1,264 | $155,916 | $36,300 | $119,616 |
| 2016 | $1,230 | $152,432 | $36,300 | $116,132 |
| 2015 | $1,206 | $149,132 | $33,000 | $116,132 |
| 2014 | $1,189 | $149,132 | $33,000 | $116,132 |
| 2013 | $1,189 | $149,132 | $33,000 | $116,132 |
Source: Public Records
Map
Nearby Homes
- 2726 Fairmont Dr
- 628 W 24th St
- 2593 Burton Ave
- 590 W 24th St
- 431 Pratt Place
- 262 Ferdinand Cir
- 731 Clear Springs St
- 2140 Daven Place
- 2435 Oakley Ave Unit Burley, ID
- 1942 Burton Ave
- 301 E 27th St
- 2960 Mcbride Place
- 519 Lake Cleveland St
- 320 E 23rd Dr
- 1729 Yale Ave
- 201 W 19th St
- 160 S 100 W
- 1719 Burton Ave
- 2441 Dorchester Ave
- 600 Oxford St