Estimated payment $22,960/month
26.95
Acres
$160,000
Price per Acre
1,173,942
Sq Ft Lot
About This Lot
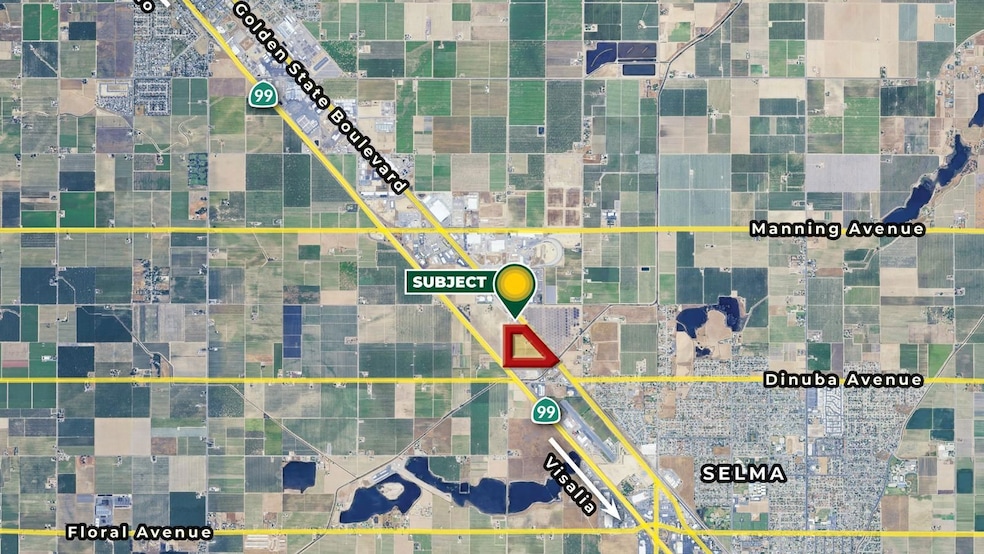
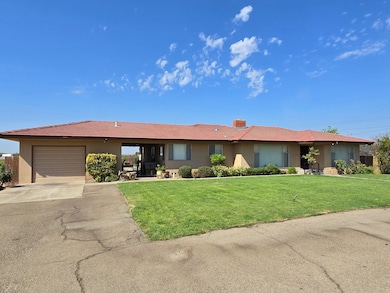
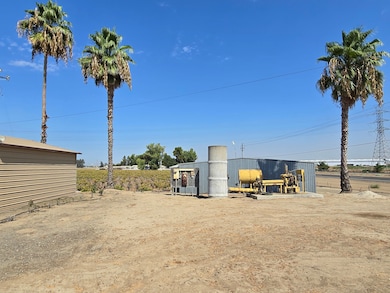
This 26.95 acre opportunity sits right next to the Selma City Limits located between the new Highway 99 and the old Highway 99 (Golden State Boulevard). The property is currently zoned for agriculture but is in the Selma Sphere of Influence General Plan as future industrial. The land already has a SKF sewer line running across the front of the property along with power and gas supplied by PG&E. The property has been farmed to Thompson raisins until this year. The vineyard was irrigated with an Ag pump and well. The home has a newer domestic pump and well along with a septic tank.
Listing Provided By

Property Details
Property Type
- Land
Est. Annual Taxes
- $3,334
Lot Details
- Current uses include agriculture, orchard/vineyards, orchard, irrigation
- Potential uses include agriculture, industrial, orchards/vineyards, orchard
Utilities
- 2 Water Wells
Map
Create a Home Valuation Report for This Property
The Home Valuation Report is an in-depth analysis detailing your home's value as well as a comparison with similar homes in the area
Home Values in the Area
Average Home Value in this Area
Tax History
| Year | Tax Paid | Tax Assessment Tax Assessment Total Assessment is a certain percentage of the fair market value that is determined by local assessors to be the total taxable value of land and additions on the property. | Land | Improvement |
|---|---|---|---|---|
| 2025 | $3,334 | $247,691 | $136,047 | $111,644 |
| 2023 | $3,327 | $238,489 | $130,765 | $107,724 |
| 2022 | $3,154 | $234,022 | $128,201 | $105,821 |
| 2021 | $3,094 | $228,674 | $125,688 | $102,986 |
| 2020 | $3,095 | $227,290 | $124,400 | $102,890 |
| 2019 | $3,040 | $222,081 | $121,961 | $100,120 |
| 2018 | $2,634 | $217,716 | $119,570 | $98,146 |
| 2017 | $2,634 | $215,443 | $117,226 | $98,217 |
| 2016 | $2,453 | $213,798 | $114,928 | $98,870 |
| 2015 | $2,422 | $203,360 | $113,202 | $90,158 |
| 2014 | $2,146 | $199,959 | $110,985 | $88,974 |
Source: Public Records
Property History
| Date | Event | Price | List to Sale | Price per Sq Ft |
|---|---|---|---|---|
| 09/15/2025 09/15/25 | For Sale | $4,312,000 | -- | -- |
Purchase History
| Date | Type | Sale Price | Title Company |
|---|---|---|---|
| Gift Deed | -- | None Listed On Document | |
| Grant Deed | -- | None Available | |
| Interfamily Deed Transfer | -- | -- | |
| Interfamily Deed Transfer | -- | -- | |
| Interfamily Deed Transfer | -- | -- |
Source: Public Records
Nearby Homes
- 8168 E Floral Ave
- 2705 Hicks St
- 3431 Oryan St
- 2615 Nelson Blvd
- 2606 Hillcrest St
- 3714 Jasper St
- 11921 de Wolf Ave
- 2577 Lewis St
- 3535 Gaynor St
- 3062 Jasper St
- 3320 Logan St
- 2753 Thompson Ave
- 343 280 01 Apn
- 2510 Whitson St
- 3280 Mccall Ave
- 1701 Dinuba Ave Unit 55
- 1701 Dinuba Ave Unit 216
- 8250 S Temperance Ave
- 2040 Cypress St
- 2591 Rose Ave
- 3670 Mccall Ave
- 901 Harold St
- 2042 Daffodil St
- 3062 19th Ave
- 2500 14th Ave Unit J
- 780 Lake St
- 1530 Edgar Ave Unit 102
- 165 E Jefferson Ave
- 2157 S Eddy Ave
- 2553 S Holloway Ave Unit 102
- 7902 Clinton Ave
- 2255 S Maple Ave
- 252 S Kona Ave
- 5120 E Kings Canyon Rd
- 6044 E Illinois Ave
- 1151 S Chestnut Ave
- 222 S Clovis Ave
- 4860 E Lane Ave
- 512 S Dearing Ave Unit 102
- 5171 E Grant Ave