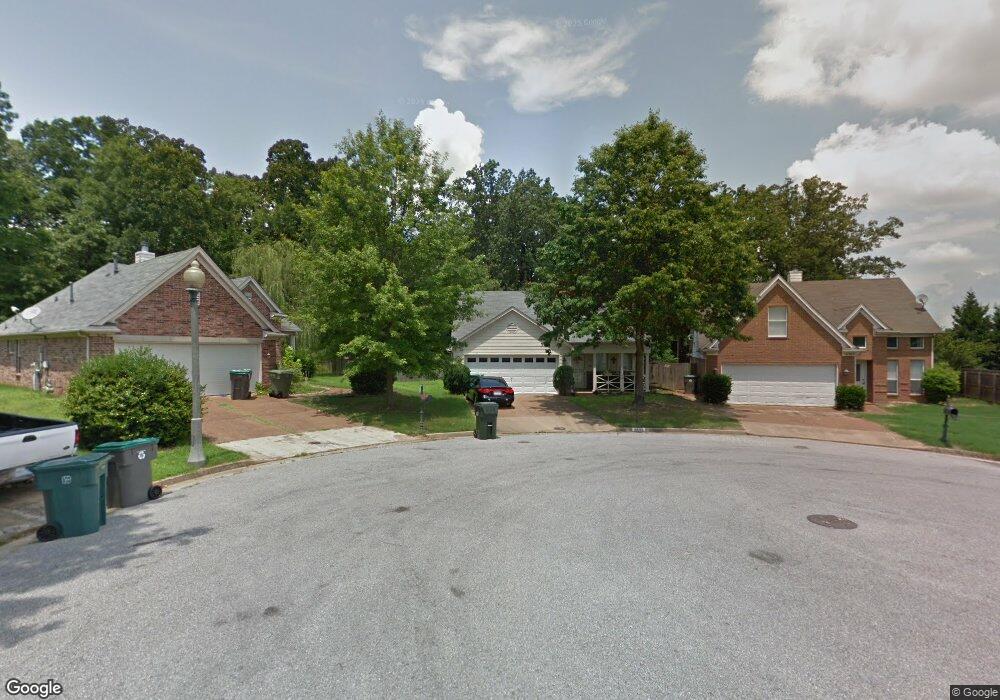
9696 Tributary Cove Arlington, TN 38002
Cordova NeighborhoodEstimated Value: $235,000 - $253,000
3
Beds
2
Baths
1,490
Sq Ft
$162/Sq Ft
Est. Value
About This Home
This home is located at 9696 Tributary Cove, Arlington, TN 38002 and is currently estimated at $242,120, approximately $162 per square foot. 9696 Tributary Cove is a home located in Shelby County with nearby schools including Chimneyrock Elementary School, Cordova High School, and Kate Bond Middle School.
Ownership History
Date
Name
Owned For
Owner Type
Purchase Details
Closed on
Apr 2, 2013
Sold by
Feroze Ahmed and Feroze Aliya
Bought by
Feroze Ahmed
Current Estimated Value
Purchase Details
Closed on
Apr 17, 2008
Sold by
The Bank Of New York Trust Co Na
Bought by
Feroze Ahmed and Ahmed Aliya
Purchase Details
Closed on
Dec 6, 2007
Sold by
Okurily Danny
Bought by
The Bank Of New York Trust Co Na and Jpmorgan Chase Bank
Purchase Details
Closed on
Feb 12, 2004
Sold by
Carney Susan S Fitzgerald
Bought by
Okurily Danny
Home Financials for this Owner
Home Financials are based on the most recent Mortgage that was taken out on this home.
Original Mortgage
$129,200
Interest Rate
8%
Mortgage Type
Purchase Money Mortgage
Purchase Details
Closed on
May 25, 2001
Sold by
Bowden Building Corp
Bought by
Fitzgerald Susan S
Home Financials for this Owner
Home Financials are based on the most recent Mortgage that was taken out on this home.
Original Mortgage
$108,300
Interest Rate
7.11%
Create a Home Valuation Report for This Property
The Home Valuation Report is an in-depth analysis detailing your home's value as well as a comparison with similar homes in the area
Home Values in the Area
Average Home Value in this Area
Purchase History
| Date | Buyer | Sale Price | Title Company |
|---|---|---|---|
| Feroze Ahmed | -- | None Available | |
| Feroze Ahmed | $76,000 | Resource Title Agency Of Tn | |
| The Bank Of New York Trust Co Na | $119,000 | None Available | |
| Okurily Danny | $125,000 | -- | |
| Fitzgerald Susan S | $128,300 | Southern Escrow Title Compan |
Source: Public Records
Mortgage History
| Date | Status | Borrower | Loan Amount |
|---|---|---|---|
| Previous Owner | Okurily Danny | $129,200 | |
| Previous Owner | Fitzgerald Susan S | $108,300 |
Source: Public Records
Tax History Compared to Growth
Tax History
| Year | Tax Paid | Tax Assessment Tax Assessment Total Assessment is a certain percentage of the fair market value that is determined by local assessors to be the total taxable value of land and additions on the property. | Land | Improvement |
|---|---|---|---|---|
| 2025 | $1,361 | $58,050 | $12,250 | $45,800 |
| 2024 | $1,361 | $40,150 | $7,500 | $32,650 |
| 2023 | $2,446 | $40,150 | $7,500 | $32,650 |
| 2022 | $2,446 | $40,150 | $7,500 | $32,650 |
| 2021 | $2,474 | $40,150 | $7,500 | $32,650 |
| 2020 | $2,228 | $30,750 | $7,500 | $23,250 |
| 2019 | $2,228 | $30,750 | $7,500 | $23,250 |
| 2018 | $2,228 | $30,750 | $7,500 | $23,250 |
| 2017 | $1,264 | $30,750 | $7,500 | $23,250 |
| 2016 | $1,212 | $27,725 | $0 | $0 |
| 2014 | $1,212 | $27,725 | $0 | $0 |
Source: Public Records
Map
Nearby Homes
- 9761 Misty Bay Cove
- 9769 Misty Pine Dr
- 9768 Riggin Dr
- 9596 Morning Shadow Dr
- 2725 Morning Sun Rd
- 2756 Maggie Woods Place
- 2746 Virginia Woods Place
- 9547 Morning Shadow Dr
- 9535 Daly Dr
- 3050 Stonecrest Cir
- 9427 Morning Woods Cove
- 2814 Morning Woods Dr
- 9400 Morning Woods Cove
- 9393 Colts Neck Rd
- 2652 Misty Woods Cove S
- 9358 Silver Hollow Cove
- 2670 Morning Grove Dr
- 3157 Nova Scotia Ln
- 2628 Morning Grove Dr
- 3098 Brandon Way Ln
- 9690 Tributary Cove
- 9702 Tributary Cove
- 9708 Tributary Cove
- 9691 Tributary Cove
- 9712 Tributary Ln
- 9712 Tributary Cove
- 0 Lakeland Hills Dr
- 9697 Tributary Cove
- 9701 Tributary Cove
- 9716 Tributary Cove
- 9709 Tributary Cove
- 2840 Morning Sun Rd
- 9713 Tributary Cove
- 9720 Tributary Ln
- 9700 Java Cove
- 2823 Java Dr
- 9687 Us 64 Hwy
- 9724 Tributary Ln
- 9704 Java Cove
- 9723 Tributary Ln