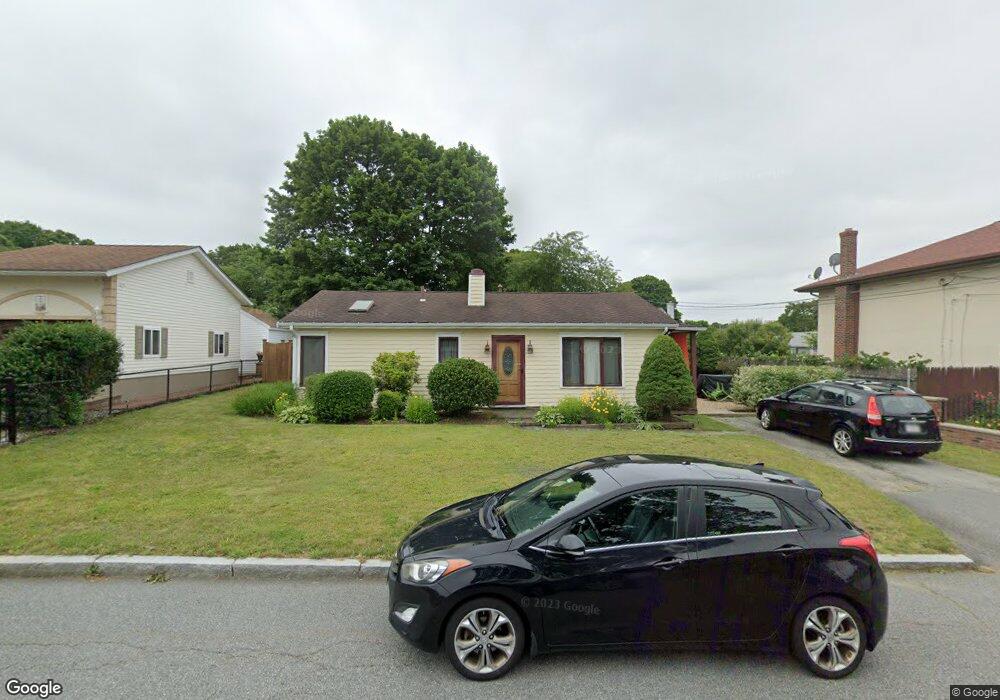
97 Dunbar St Fall River, MA 02723
Bank Street NeighborhoodEstimated Value: $367,494 - $409,000
2
Beds
1
Bath
900
Sq Ft
$437/Sq Ft
Est. Value
About This Home
This home is located at 97 Dunbar St, Fall River, MA 02723 and is currently estimated at $393,374, approximately $437 per square foot. 97 Dunbar St is a home located in Bristol County with nearby schools including Mary Fonseca Elementary School, Talbot Innovation School, and B M C Durfee High School.
Ownership History
Date
Name
Owned For
Owner Type
Purchase Details
Closed on
Aug 27, 2001
Sold by
Pereira Arsenio F
Bought by
Boffi Angela R and Andrade Rebecca A
Current Estimated Value
Home Financials for this Owner
Home Financials are based on the most recent Mortgage that was taken out on this home.
Original Mortgage
$132,050
Outstanding Balance
$52,317
Interest Rate
7.21%
Mortgage Type
Purchase Money Mortgage
Estimated Equity
$341,057
Purchase Details
Closed on
Jan 26, 2001
Sold by
Condon Richard M
Bought by
Pereira Arsenio F
Purchase Details
Closed on
Dec 4, 2000
Sold by
Machado Debra Ann
Bought by
Condon Richard M and Pereira Arsenio F
Purchase Details
Closed on
Jul 18, 1990
Sold by
Heap Evangelina A
Bought by
Machado Debra Ann
Create a Home Valuation Report for This Property
The Home Valuation Report is an in-depth analysis detailing your home's value as well as a comparison with similar homes in the area
Home Values in the Area
Average Home Value in this Area
Purchase History
| Date | Buyer | Sale Price | Title Company |
|---|---|---|---|
| Boffi Angela R | $139,000 | -- | |
| Pereira Arsenio F | $55,000 | -- | |
| Condon Richard M | $99,000 | -- | |
| Machado Debra Ann | $112,500 | -- |
Source: Public Records
Mortgage History
| Date | Status | Borrower | Loan Amount |
|---|---|---|---|
| Open | Machado Debra Ann | $40,000 | |
| Closed | Machado Debra Ann | $22,000 | |
| Open | Machado Debra Ann | $132,050 |
Source: Public Records
Tax History Compared to Growth
Tax History
| Year | Tax Paid | Tax Assessment Tax Assessment Total Assessment is a certain percentage of the fair market value that is determined by local assessors to be the total taxable value of land and additions on the property. | Land | Improvement |
|---|---|---|---|---|
| 2025 | $3,556 | $310,600 | $135,700 | $174,900 |
| 2024 | $3,346 | $291,200 | $130,500 | $160,700 |
| 2023 | $3,174 | $258,700 | $117,100 | $141,600 |
| 2022 | $2,859 | $224,600 | $108,400 | $116,200 |
| 2021 | $2,859 | $206,700 | $102,400 | $104,300 |
| 2020 | $2,682 | $185,600 | $98,600 | $87,000 |
| 2019 | $2,614 | $179,300 | $98,600 | $80,700 |
| 2018 | $2,589 | $177,100 | $98,600 | $78,500 |
| 2017 | $2,460 | $175,700 | $98,600 | $77,100 |
| 2016 | $2,343 | $171,900 | $98,600 | $73,300 |
| 2015 | $2,169 | $165,800 | $92,200 | $73,600 |
| 2014 | $2,086 | $165,800 | $92,200 | $73,600 |
Source: Public Records
Map
Nearby Homes