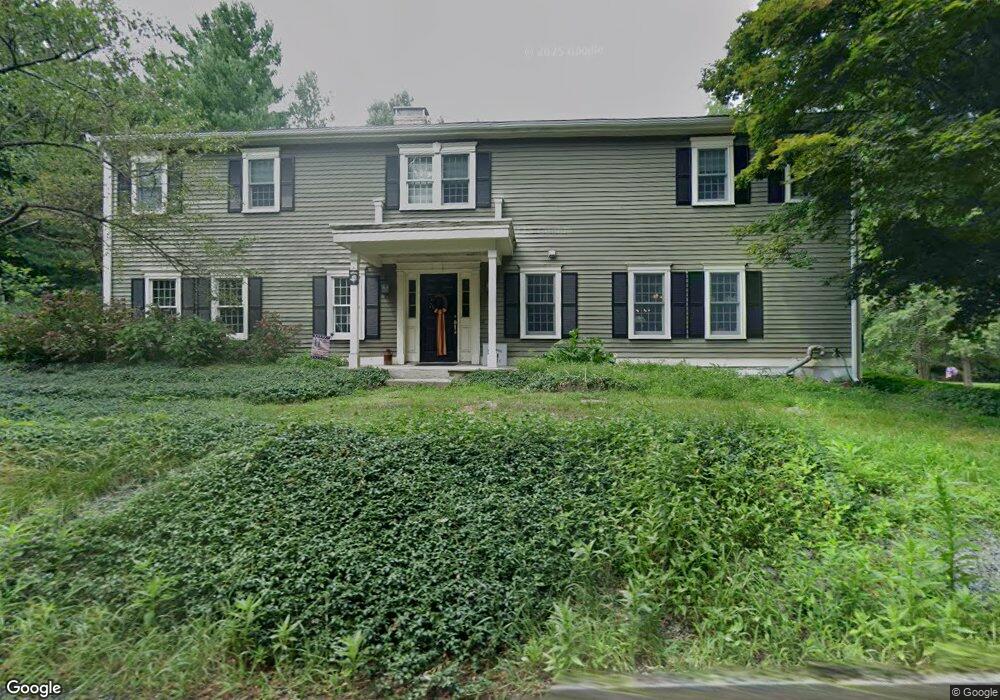
971 West St Mansfield, MA 02048
Estimated Value: $802,000 - $1,037,000
4
Beds
3
Baths
3,404
Sq Ft
$262/Sq Ft
Est. Value
About This Home
This home is located at 971 West St, Mansfield, MA 02048 and is currently estimated at $891,568, approximately $261 per square foot. 971 West St is a home located in Bristol County with nearby schools including Everett W. Robinson Elementary School, Jordan/Jackson Elementary School, and Harold L. Qualters Middle School.
Ownership History
Date
Name
Owned For
Owner Type
Purchase Details
Closed on
Jan 30, 2009
Sold by
Fitzgerald Sandra M and Fitzgerald Terrence M
Bought by
Curley Patrick A and Kiander Sherry L
Current Estimated Value
Home Financials for this Owner
Home Financials are based on the most recent Mortgage that was taken out on this home.
Original Mortgage
$413,200
Interest Rate
5.28%
Mortgage Type
VA
Purchase Details
Closed on
Jun 24, 1994
Sold by
Ristaino Sheila M and Azarian Sheila M
Bought by
Fitzgerald Terrence M and Fitzgerald Sandra M
Create a Home Valuation Report for This Property
The Home Valuation Report is an in-depth analysis detailing your home's value as well as a comparison with similar homes in the area
Home Values in the Area
Average Home Value in this Area
Purchase History
| Date | Buyer | Sale Price | Title Company |
|---|---|---|---|
| Curley Patrick A | $400,000 | -- | |
| Fitzgerald Terrence M | $210,000 | -- |
Source: Public Records
Mortgage History
| Date | Status | Borrower | Loan Amount |
|---|---|---|---|
| Open | Fitzgerald Terrence M | $409,036 | |
| Closed | Curley Patrick A | $413,200 | |
| Previous Owner | Fitzgerald Terrence M | $100,000 |
Source: Public Records
Tax History Compared to Growth
Tax History
| Year | Tax Paid | Tax Assessment Tax Assessment Total Assessment is a certain percentage of the fair market value that is determined by local assessors to be the total taxable value of land and additions on the property. | Land | Improvement |
|---|---|---|---|---|
| 2025 | $9,742 | $739,700 | $242,900 | $496,800 |
| 2024 | $8,189 | $606,600 | $242,900 | $363,700 |
| 2023 | $7,380 | $523,800 | $242,900 | $280,900 |
| 2022 | $7,092 | $467,500 | $224,800 | $242,700 |
| 2021 | $7,932 | $516,400 | $196,800 | $319,600 |
| 2020 | $7,106 | $462,600 | $187,400 | $275,200 |
| 2019 | $7,689 | $505,200 | $156,100 | $349,100 |
| 2018 | $7,169 | $527,600 | $148,900 | $378,700 |
| 2017 | $6,885 | $458,400 | $144,700 | $313,700 |
| 2016 | $6,318 | $410,000 | $137,700 | $272,300 |
| 2015 | $6,355 | $410,000 | $137,700 | $272,300 |
Source: Public Records
Map
Nearby Homes