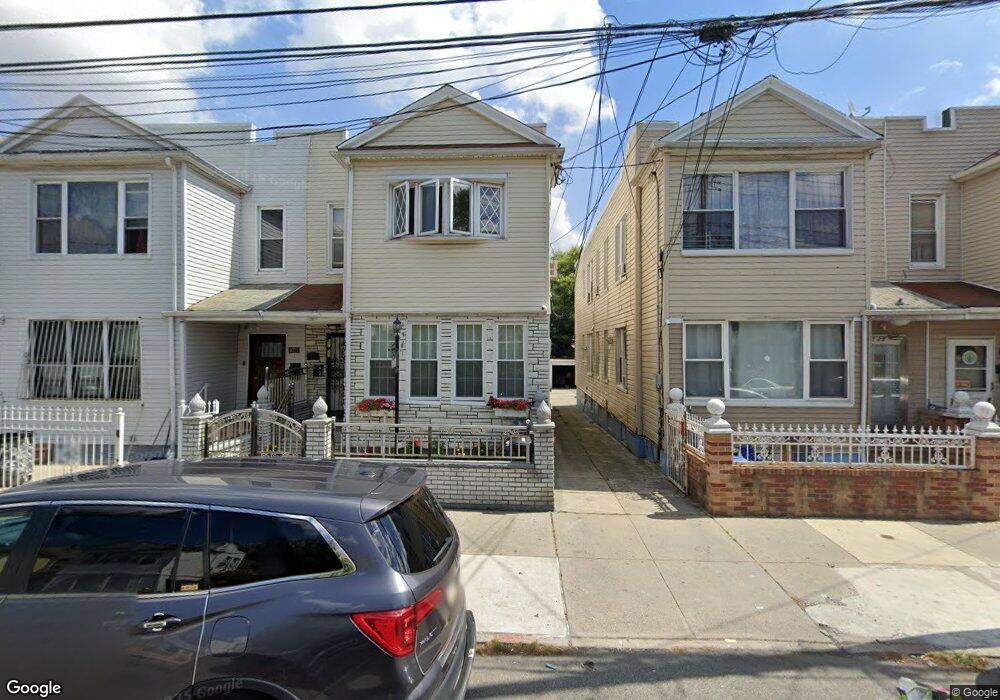
9723 Drew St Jamaica, NY 11416
Ozone Park NeighborhoodEstimated Value: $849,110 - $1,045,000
--
Bed
--
Bath
2,082
Sq Ft
$455/Sq Ft
Est. Value
About This Home
This home is located at 9723 Drew St, Jamaica, NY 11416 and is currently estimated at $947,528, approximately $455 per square foot. 9723 Drew St is a home located in Queens County with nearby schools including P.S. 64 - Joseph P. Addabbo, Jhs 210 Elizabeth Blackwell, and Cypress Hills Ascend Charter Lower School.
Ownership History
Date
Name
Owned For
Owner Type
Purchase Details
Closed on
Nov 11, 2017
Sold by
Khan Aslim I and Khan Diana
Bought by
Khan Aslim I and Khan Diana
Current Estimated Value
Purchase Details
Closed on
May 2, 2016
Sold by
Aslim Khan Income Tax Service Inc
Bought by
Khan Aslim I and Khan Diana
Purchase Details
Closed on
Sep 26, 2013
Sold by
Khan Keith I
Bought by
Aslim Khan Income Tax Service Inc
Purchase Details
Closed on
Mar 6, 2013
Sold by
Kenneth Kirschenbaum Trustee
Bought by
Khan Keith I
Create a Home Valuation Report for This Property
The Home Valuation Report is an in-depth analysis detailing your home's value as well as a comparison with similar homes in the area
Home Values in the Area
Average Home Value in this Area
Purchase History
| Date | Buyer | Sale Price | Title Company |
|---|---|---|---|
| Khan Aslim I | -- | -- | |
| Khan Aslim I | -- | -- | |
| Khan Aslim I | -- | -- | |
| Khan Aslim I | -- | -- | |
| Aslim Khan Income Tax Service Inc | -- | -- | |
| Aslim Khan Income Tax Service Inc | -- | -- | |
| Khan Keith I | $480,000 | -- | |
| Khan Keith I | $480,000 | -- |
Source: Public Records
Tax History Compared to Growth
Tax History
| Year | Tax Paid | Tax Assessment Tax Assessment Total Assessment is a certain percentage of the fair market value that is determined by local assessors to be the total taxable value of land and additions on the property. | Land | Improvement |
|---|---|---|---|---|
| 2025 | $7,986 | $40,046 | $11,308 | $28,738 |
| 2024 | $7,986 | $39,763 | $12,667 | $27,096 |
| 2023 | $7,058 | $35,141 | $11,743 | $23,398 |
| 2022 | $6,618 | $49,380 | $15,960 | $33,420 |
| 2021 | $6,582 | $46,680 | $15,960 | $30,720 |
| 2020 | $6,620 | $45,780 | $15,960 | $29,820 |
| 2019 | $6,493 | $44,760 | $15,960 | $28,800 |
| 2018 | $5,970 | $29,284 | $12,707 | $16,577 |
| 2017 | $5,632 | $27,627 | $12,434 | $15,193 |
| 2016 | $5,210 | $27,627 | $12,434 | $15,193 |
| 2015 | $3,143 | $26,064 | $15,788 | $10,276 |
| 2014 | $3,143 | $25,868 | $16,411 | $9,457 |
Source: Public Records
Map
Nearby Homes