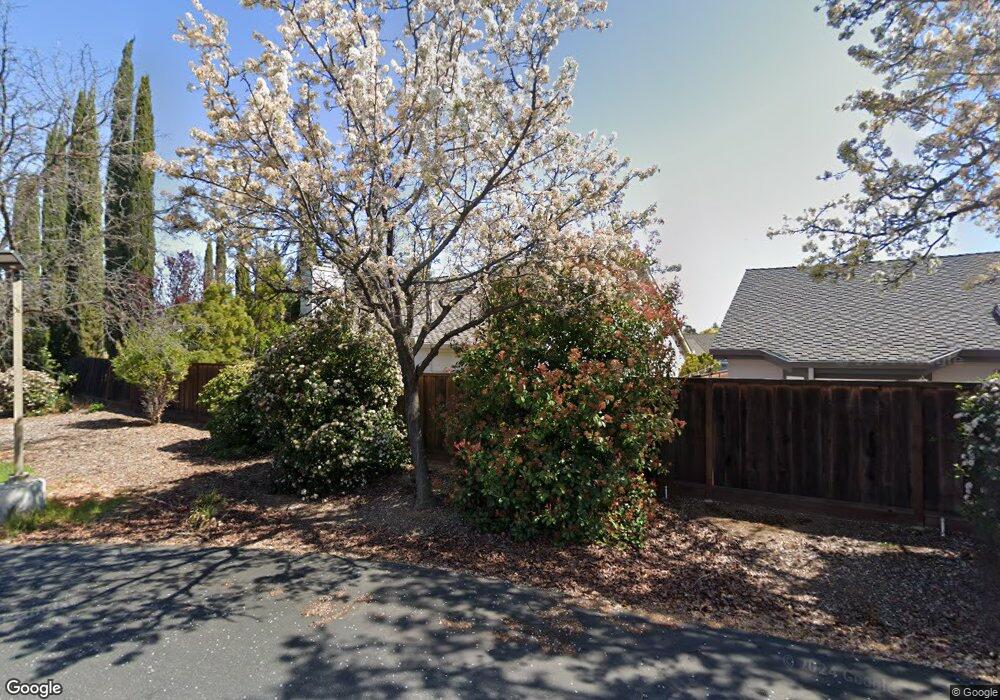
973 Clinton Place Pleasanton, CA 94566
Estimated Value: $1,374,000 - $1,530,000
4
Beds
3
Baths
2,046
Sq Ft
$717/Sq Ft
Est. Value
About This Home
This home is located at 973 Clinton Place, Pleasanton, CA 94566 and is currently estimated at $1,467,643, approximately $717 per square foot. 973 Clinton Place is a home located in Alameda County with nearby schools including Valley View Elementary School, Pleasanton Middle School, and Amador Valley High School.
Ownership History
Date
Name
Owned For
Owner Type
Purchase Details
Closed on
Apr 16, 2016
Sold by
Saleh Fatima
Bought by
Saleh Fatima Nooshin and Fatima Nooshin Saleh Trust
Current Estimated Value
Purchase Details
Closed on
Aug 11, 2014
Sold by
Iarussi Renard S and The Renard S Iarussi Revocable
Bought by
Saleh Fatima
Purchase Details
Closed on
Apr 8, 2003
Sold by
Iarussi Renard S
Bought by
Iarussi Renard S and Iarussi Revocable Liv Renard S
Purchase Details
Closed on
Jul 26, 2001
Sold by
Wu Chien Kuo
Bought by
Larussi Renard S
Home Financials for this Owner
Home Financials are based on the most recent Mortgage that was taken out on this home.
Original Mortgage
$255,000
Interest Rate
7.09%
Purchase Details
Closed on
Jul 25, 2001
Sold by
Larussi Laura L
Bought by
Larussi Renard S
Home Financials for this Owner
Home Financials are based on the most recent Mortgage that was taken out on this home.
Original Mortgage
$255,000
Interest Rate
7.09%
Create a Home Valuation Report for This Property
The Home Valuation Report is an in-depth analysis detailing your home's value as well as a comparison with similar homes in the area
Home Values in the Area
Average Home Value in this Area
Purchase History
| Date | Buyer | Sale Price | Title Company |
|---|---|---|---|
| Saleh Fatima Nooshin | -- | None Available | |
| Saleh Fatima | $810,000 | Old Republic Title Company | |
| Iarussi Renard S | -- | -- | |
| Larussi Renard S | $465,000 | New Century Title Company | |
| Larussi Renard S | -- | New Century Title Company |
Source: Public Records
Mortgage History
| Date | Status | Borrower | Loan Amount |
|---|---|---|---|
| Previous Owner | Larussi Renard S | $255,000 |
Source: Public Records
Tax History Compared to Growth
Tax History
| Year | Tax Paid | Tax Assessment Tax Assessment Total Assessment is a certain percentage of the fair market value that is determined by local assessors to be the total taxable value of land and additions on the property. | Land | Improvement |
|---|---|---|---|---|
| 2025 | $5,465 | $468,546 | $166,115 | $309,431 |
| 2024 | $5,465 | $459,224 | $162,859 | $303,365 |
| 2023 | $5,400 | $457,084 | $159,666 | $297,418 |
| 2022 | $5,116 | $441,122 | $156,536 | $291,586 |
| 2021 | $4,983 | $432,339 | $153,468 | $285,871 |
| 2020 | $4,919 | $434,835 | $151,894 | $282,941 |
| 2019 | $4,977 | $426,312 | $148,917 | $277,395 |
| 2018 | $4,875 | $417,955 | $145,998 | $271,957 |
| 2017 | $4,750 | $409,762 | $143,136 | $266,626 |
| 2016 | $4,381 | $401,727 | $140,329 | $261,398 |
| 2015 | $4,315 | $395,695 | $138,222 | $257,473 |
| 2014 | $6,400 | $560,361 | $168,108 | $392,253 |
Source: Public Records
Map
Nearby Homes
- 786 Bonita Ave
- 789 E Angela St
- 4253 Mirador Dr
- 601 Palomino Dr Unit C
- 3550 Arbor Ct
- 665 Palomino Dr Unit D
- 1312 Vintner Way
- 3379 Arbor Dr
- 3399 Norton Way Unit 6
- 588 E Angela St
- 3375 Norton Way Unit 5
- 543 Tawny Dr
- 526 Malbec Ct
- 4525 Entrada Ct
- 262 Birch Creek Dr
- 373 Linden Way
- 236 Birch Creek Terrace Unit 14
- 3845 Vineyard Ave Unit F
- 215 Mavis Dr
- 3249 Arbor Dr
- 979 Clinton Place
- 967 Clinton Place
- 961 Clinton Place
- 985 Clinton Place
- 982 Clinton Place
- 974 Clinton Place
- 966 Clinton Place
- 921 Clinton Place
- 905 Clinton Place
- 991 Clinton Place
- 958 Clinton Place
- 950 Clinton Place
- 926 Clinton Place
- 918 Clinton Place
- 910 Clinton Place
- 934 Clinton Place
- 902 Clinton Place
- 4119 Garibaldi Place
- 1008 Hearst Dr
- 4131 Garibaldi Place