
Seller's Agent in 2016
Kirk Jefferis
Cityscape Real Estate, Inc.
(217) 971-2258
1 Total Sale
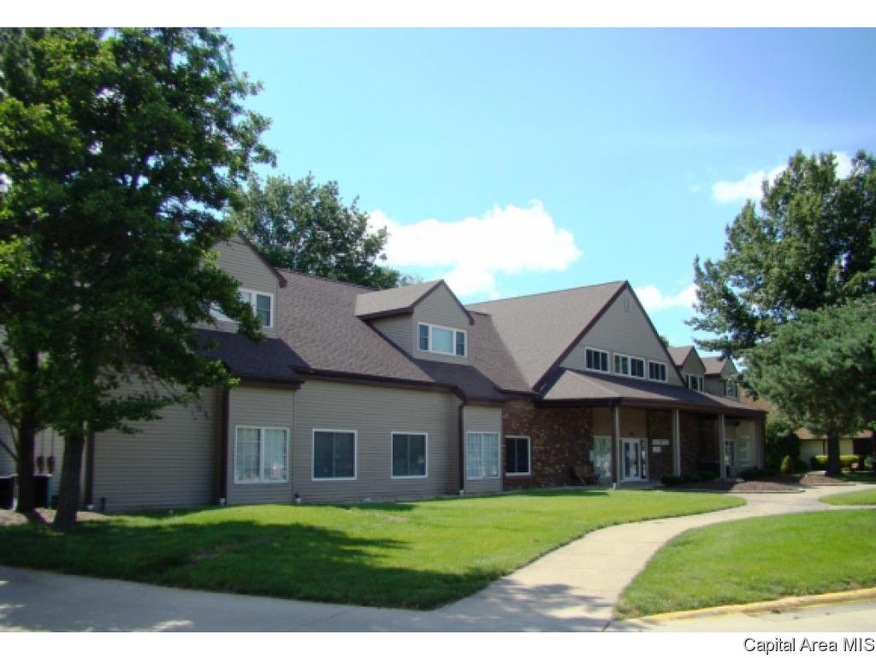
Very nice 2nd floor office space in the Clock Tower area. Currenly divided into 2 single offices with entry/reception area, and conference room.
Last Agent to Sell the Property
Cityscape Real Estate, Inc. License #471004703 Listed on: 09/16/2015
Property Type
Other
Est. Annual Taxes
$11,805
Lot Details
0
Listing Details
Interior Features
Lot Info
Rental Info
| Date | Buyer | Sale Price | Title Company |
|---|---|---|---|
| -- | $195,000 | -- | |
| -- | -- | -- | |
| -- | -- | -- | |
| -- | $580,000 | -- | |
| -- | -- | -- | |
| -- | -- | -- | |
| -- | -- | -- | |
| -- | $355,000 | -- | |
| -- | -- | -- |
| Date | Event | Price | Change | Sq Ft Price |
|---|---|---|---|---|
| 06/10/2016 06/10/16 | Sold | -- | -- | -- |
| 05/11/2016 05/11/16 | Pending | -- | -- | -- |
| 09/16/2015 09/16/15 | For Sale | $750 | -- | $1 / Sq Ft |
| Year | Tax Paid | Tax Assessment Tax Assessment Total Assessment is a certain percentage of the fair market value that is determined by local assessors to be the total taxable value of land and additions on the property. | Land | Improvement |
|---|---|---|---|---|
| 2024 | $11,805 | $140,547 | $86,520 | $54,027 |
| 2023 | $11,350 | $128,377 | $79,028 | $49,349 |
| 2022 | $10,912 | $121,777 | $74,965 | $46,812 |
| 2021 | $10,551 | $117,217 | $72,158 | $45,059 |
| 2020 | $10,341 | $117,393 | $72,266 | $45,127 |
| 2019 | $10,149 | $116,984 | $72,014 | $44,970 |
| 2018 | $10,329 | $122,246 | $71,618 | $50,628 |
| 2017 | $10,115 | $120,665 | $70,692 | $49,973 |
| 2016 | $9,916 | $118,905 | $69,661 | $49,244 |
| 2015 | $9,820 | $117,483 | $68,828 | $48,655 |
| 2014 | $9,673 | $116,725 | $68,384 | $48,341 |
| 2013 | $9,457 | $116,725 | $68,384 | $48,341 |
Seller's Agent in 2016
Kirk Jefferis
Cityscape Real Estate, Inc.
(217) 971-2258
1 Total Sale
Source: RMLS Alliance
MLS Number: RMACA156055
APN: 14-31.0-377-014
Disclaimer: Certain information contained herein is derived from information provided by parties other than Homes.com. All information provided is deemed reliable, but is not guaranteed to be accurate and should be independently verified.
![]() IDX information is provided exclusively for personal, non-commercial use, and may not be used for any purpose other than to identify prospective properties consumers may be interested in purchasing. Information is deemed reliable but not guaranteed.
IDX information is provided exclusively for personal, non-commercial use, and may not be used for any purpose other than to identify prospective properties consumers may be interested in purchasing. Information is deemed reliable but not guaranteed.