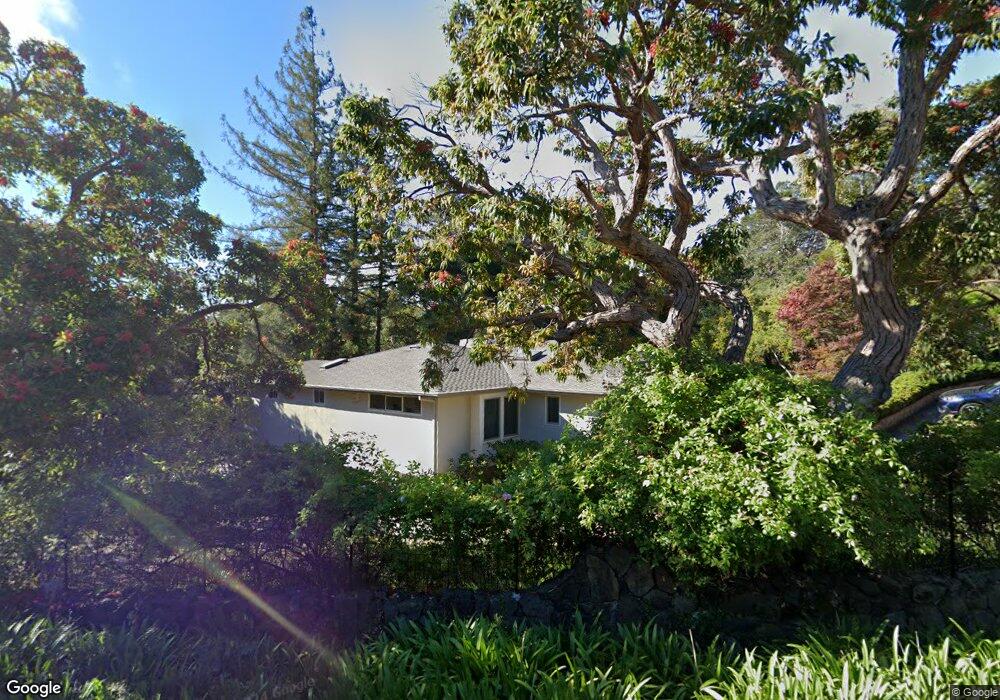
975 Vista Rd Hillsborough, CA 94010
Estimated Value: $4,505,000 - $5,868,000
5
Beds
6
Baths
4,029
Sq Ft
$1,251/Sq Ft
Est. Value
About This Home
This home is located at 975 Vista Rd, Hillsborough, CA 94010 and is currently estimated at $5,039,035, approximately $1,250 per square foot. 975 Vista Rd is a home located in San Mateo County with nearby schools including South Hillsborough Elementary School, Crocker Middle School, and San Mateo High School.
Ownership History
Date
Name
Owned For
Owner Type
Purchase Details
Closed on
May 15, 2013
Sold by
Weil Norman and Weil Joyce
Bought by
Weil Norman I and Weil Joyce D
Current Estimated Value
Purchase Details
Closed on
Feb 15, 2013
Sold by
Weil Norman I and Weil Joyce D
Bought by
Weil Norman and Weil Joyce
Home Financials for this Owner
Home Financials are based on the most recent Mortgage that was taken out on this home.
Original Mortgage
$950,000
Interest Rate
2.76%
Mortgage Type
New Conventional
Purchase Details
Closed on
Dec 4, 2002
Sold by
Weil Norman and Weil Joyce
Bought by
Weil Norman I and Weil Joyce D
Home Financials for this Owner
Home Financials are based on the most recent Mortgage that was taken out on this home.
Original Mortgage
$500,000
Interest Rate
5.65%
Purchase Details
Closed on
Feb 17, 1999
Sold by
Norman Weil and Norman Joyce D
Bought by
Weil Norman I and Weil Joyce D
Create a Home Valuation Report for This Property
The Home Valuation Report is an in-depth analysis detailing your home's value as well as a comparison with similar homes in the area
Home Values in the Area
Average Home Value in this Area
Purchase History
| Date | Buyer | Sale Price | Title Company |
|---|---|---|---|
| Weil Norman I | -- | None Available | |
| Weil Norman | -- | None Available | |
| Weil Norman I | -- | -- | |
| Weil Norman | -- | Old Republic Title Company | |
| Weil Norman I | -- | -- |
Source: Public Records
Mortgage History
| Date | Status | Borrower | Loan Amount |
|---|---|---|---|
| Closed | Weil Norman | $950,000 | |
| Closed | Weil Norman | $500,000 |
Source: Public Records
Tax History Compared to Growth
Tax History
| Year | Tax Paid | Tax Assessment Tax Assessment Total Assessment is a certain percentage of the fair market value that is determined by local assessors to be the total taxable value of land and additions on the property. | Land | Improvement |
|---|---|---|---|---|
| 2025 | $24,187 | $1,677,621 | $736,812 | $940,809 |
| 2023 | $24,187 | $1,612,478 | $708,201 | $904,277 |
| 2022 | $22,806 | $1,580,862 | $694,315 | $886,547 |
| 2021 | $22,262 | $1,549,865 | $680,701 | $869,164 |
| 2020 | $21,830 | $1,533,974 | $673,722 | $860,252 |
| 2019 | $21,257 | $1,503,898 | $660,512 | $843,386 |
| 2018 | $20,585 | $1,474,411 | $647,561 | $826,850 |
| 2017 | $20,121 | $1,445,502 | $634,864 | $810,638 |
| 2016 | $19,506 | $1,417,160 | $622,416 | $794,744 |
| 2015 | $19,106 | $1,395,875 | $613,067 | $782,808 |
| 2014 | $18,571 | $1,368,532 | $601,058 | $767,474 |
Source: Public Records
Map
Nearby Homes
- 0 Crystal Springs Rd
- 923 Hayne Rd
- 745 Endfield Way
- 1050 Hayne Rd
- 18 Wildwood Dr
- 897 Parrott Dr
- 340 Arden Rd
- 380 Arden Rd
- 625 W Santa Inez Ave
- 1111 Tournament Dr
- 1600 Marlborough Rd
- 638 Oregon Ave
- 1620 Marlborough Rd
- 0 Tartan Trail Rd
- 465 El Centro Rd
- 414 Pinehill Rd
- 30 Bluebell Ln
- 830 Bromfield Rd
- 1531 Wedgewood Dr
- 353 Franklin St
- 981 La Senda Rd
- 970 Vista Rd
- 985 La Senda Rd
- 950 Vista Rd
- 960 La Senda Rd
- 975 La Senda Rd
- 935 Vista Rd
- 1025 La Cuesta Rd
- 935 Culebra Rd
- 945 Culebra Rd
- 930 Vista Rd
- 1005 Vista Rd
- 925 Culebra Rd
- 940 La Senda Rd
- 1041 La Cuesta Rd
- 965 La Senda Rd
- 915 Culebra Rd
- 915 La Senda Rd
- 925 Vista Rd
- 1025 Vista Rd