Estimated Value: $529,000 - $799,000
3
Beds
2
Baths
1,560
Sq Ft
$450/Sq Ft
Est. Value
About This Home
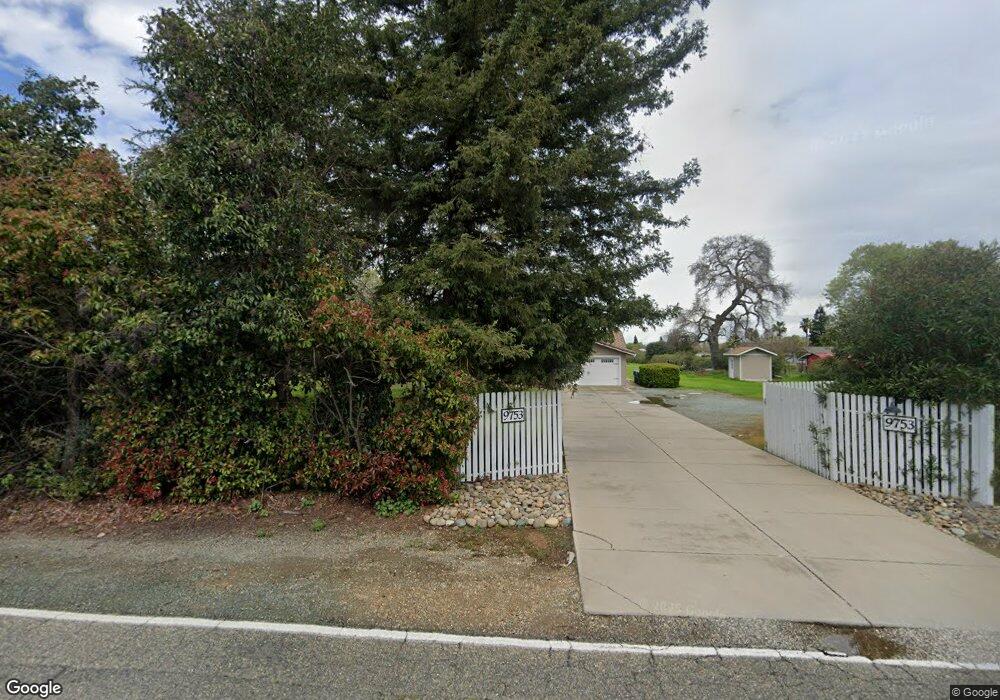
This home is located at 9753 New Hope Rd, Galt, CA 95632 and is currently estimated at $701,944, approximately $449 per square foot. 9753 New Hope Rd is a home located in Sacramento County with nearby schools including Vernon E. Greer Elementary School, Robert L. McCaffrey Middle School, and Galt High School.
Ownership History
Date
Name
Owned For
Owner Type
Purchase Details
Closed on
Sep 25, 2015
Sold by
Abbott Tamiko H
Bought by
Abbott Tamiko H
Current Estimated Value
Purchase Details
Closed on
Oct 28, 2011
Sold by
Abbott Tamiko H
Bought by
Abbott Tamiko H
Home Financials for this Owner
Home Financials are based on the most recent Mortgage that was taken out on this home.
Original Mortgage
$200,000
Outstanding Balance
$136,381
Interest Rate
4.02%
Mortgage Type
New Conventional
Estimated Equity
$565,563
Purchase Details
Closed on
Aug 16, 2011
Sold by
Abbott Michael E
Bought by
Abbott Tamiko H
Purchase Details
Closed on
Oct 9, 2000
Sold by
Kirby William L and Kirby Donna M
Bought by
Abbott Michael E and Abbott Tamiko H
Purchase Details
Closed on
May 16, 2000
Sold by
Kirby William L and Kirby Donna M
Bought by
Kirby William L and Kirby Donna M
Create a Home Valuation Report for This Property
The Home Valuation Report is an in-depth analysis detailing your home's value as well as a comparison with similar homes in the area
Home Values in the Area
Average Home Value in this Area
Purchase History
| Date | Buyer | Sale Price | Title Company |
|---|---|---|---|
| Abbott Tamiko H | -- | None Available | |
| Abbott Tamiko H | -- | Chicago Title Company | |
| Abbott Tamiko H | -- | None Available | |
| Abbott Michael E | $230,000 | Financial Title Company | |
| Kirby William L | -- | -- |
Source: Public Records
Mortgage History
| Date | Status | Borrower | Loan Amount |
|---|---|---|---|
| Open | Abbott Tamiko H | $200,000 |
Source: Public Records
Tax History Compared to Growth
Tax History
| Year | Tax Paid | Tax Assessment Tax Assessment Total Assessment is a certain percentage of the fair market value that is determined by local assessors to be the total taxable value of land and additions on the property. | Land | Improvement |
|---|---|---|---|---|
| 2025 | $4,424 | $404,501 | $120,536 | $283,965 |
| 2024 | $4,424 | $396,571 | $118,173 | $278,398 |
| 2023 | $4,313 | $388,796 | $115,856 | $272,940 |
| 2022 | $4,138 | $381,174 | $113,585 | $267,589 |
| 2021 | $4,142 | $373,701 | $111,358 | $262,343 |
| 2020 | $4,106 | $369,870 | $110,217 | $259,653 |
| 2019 | $4,003 | $362,618 | $108,056 | $254,562 |
| 2018 | $3,996 | $355,509 | $105,938 | $249,571 |
| 2017 | $3,838 | $348,539 | $103,861 | $244,678 |
| 2016 | $3,687 | $341,706 | $101,825 | $239,881 |
| 2015 | $3,559 | $336,574 | $100,296 | $236,278 |
| 2014 | $3,549 | $329,982 | $98,332 | $231,650 |
Source: Public Records
Map
Nearby Homes
- 9790 Harvey Rd
- 14116 Sargent Ave
- 0 Kost Rd Unit 225103002
- 0 Kost Rd Unit 225139781
- 14076 Saradale Ln
- 248 Rio Mesa Way
- 9999 Orr Rd
- 211 Wren Dr
- 906 Tudor St
- 365 Sparrow Dr
- 327 Shelduck Ln
- 217 Sandpiper Dr
- 19 A St
- 10240 Kost Rd
- 616 1st St
- 176 Guild St
- 998 Fernando Way
- 174 Trent Dr
- 700 2nd St Unit 14
- 242 3rd St
- 9737 New Hope Rd
- 9764 New Hope Rd
- 9783 New Hope Rd
- 13970 Simko Ranch Ln
- 9758 New Hope Rd
- 9780 New Hope Rd
- 9720 New Hope Rd
- 9731 New Hope Rd
- 13991 Simko Ranch Ln
- 13985 Christensen Rd
- 13969 Simko Ranch Ln
- 9749 New Hope Rd
- 13950 Simko Ranch Ln
- 13971 Christensen Rd
- 9800 New Hope Rd
- 9708 New Hope Rd
- 13965 Christensen Rd
- 14030 Emilee Ln
- 9768 New Hope Rd
- 13940 Simko Ranch Ln