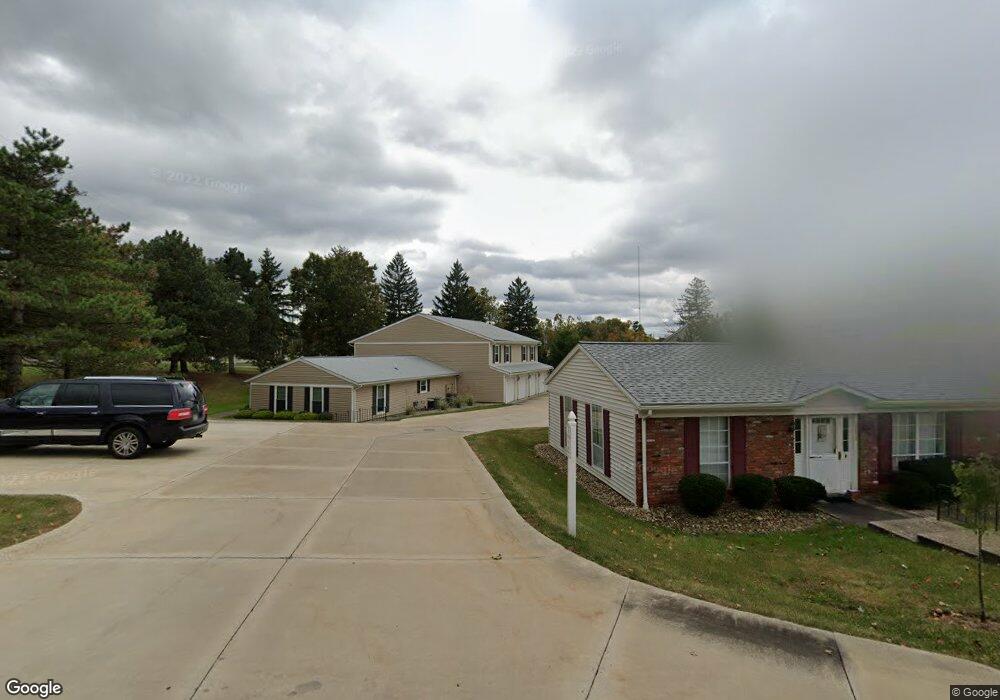
9755 Independence Dr Unit B1 North Royalton, OH 44133
Estimated Value: $133,222 - $160,000
2
Beds
1
Bath
924
Sq Ft
$161/Sq Ft
Est. Value
About This Home
This home is located at 9755 Independence Dr Unit B1, North Royalton, OH 44133 and is currently estimated at $148,556, approximately $160 per square foot. 9755 Independence Dr Unit B1 is a home located in Cuyahoga County with nearby schools including North Royalton Middle School, North Royalton High School, and Saint Albert the Great Roman Catholic School.
Ownership History
Date
Name
Owned For
Owner Type
Purchase Details
Closed on
May 23, 2007
Sold by
Bitting Katie L
Bought by
Hasychak Jeffrey M
Current Estimated Value
Home Financials for this Owner
Home Financials are based on the most recent Mortgage that was taken out on this home.
Original Mortgage
$62,800
Outstanding Balance
$38,407
Interest Rate
6.27%
Mortgage Type
Purchase Money Mortgage
Estimated Equity
$110,149
Purchase Details
Closed on
Sep 15, 2003
Sold by
Baron Karen
Bought by
Bitting Katie L
Home Financials for this Owner
Home Financials are based on the most recent Mortgage that was taken out on this home.
Original Mortgage
$53,500
Interest Rate
6.18%
Mortgage Type
Purchase Money Mortgage
Purchase Details
Closed on
Sep 29, 1992
Sold by
Fisher Lorene R
Bought by
Cooper Linda A
Purchase Details
Closed on
May 16, 1986
Sold by
Varga Zolton J and Varga Piroska
Bought by
Fisher Lorene R
Purchase Details
Closed on
Jan 1, 1975
Bought by
Varga Zolton J and Varga Piroska
Create a Home Valuation Report for This Property
The Home Valuation Report is an in-depth analysis detailing your home's value as well as a comparison with similar homes in the area
Home Values in the Area
Average Home Value in this Area
Purchase History
| Date | Buyer | Sale Price | Title Company |
|---|---|---|---|
| Hasychak Jeffrey M | $78,500 | Executive Title Agency | |
| Bitting Katie L | $63,000 | Real Estate Title | |
| Cooper Linda A | $62,000 | -- | |
| Fisher Lorene R | $40,000 | -- | |
| Varga Zolton J | -- | -- |
Source: Public Records
Mortgage History
| Date | Status | Borrower | Loan Amount |
|---|---|---|---|
| Open | Hasychak Jeffrey M | $62,800 | |
| Previous Owner | Bitting Katie L | $53,500 |
Source: Public Records
Tax History Compared to Growth
Tax History
| Year | Tax Paid | Tax Assessment Tax Assessment Total Assessment is a certain percentage of the fair market value that is determined by local assessors to be the total taxable value of land and additions on the property. | Land | Improvement |
|---|---|---|---|---|
| 2024 | $2,480 | $42,700 | $4,270 | $38,430 |
| 2023 | $1,860 | $29,370 | $2,940 | $26,430 |
| 2022 | $1,848 | $29,370 | $2,940 | $26,430 |
| 2021 | $1,867 | $29,370 | $2,940 | $26,430 |
| 2020 | $1,489 | $22,260 | $2,240 | $20,020 |
| 2019 | $1,445 | $63,600 | $6,400 | $57,200 |
| 2018 | $1,362 | $22,260 | $2,240 | $20,020 |
| 2017 | $1,349 | $19,640 | $1,960 | $17,680 |
| 2016 | $1,264 | $19,640 | $1,960 | $17,680 |
| 2015 | $1,592 | $19,640 | $1,960 | $17,680 |
| 2014 | $1,592 | $24,540 | $2,450 | $22,090 |
Source: Public Records
Map
Nearby Homes
- 11550 York Rd
- 9611 Sunrise Blvd Unit K2
- 9530 Cove Dr Unit C-25
- 9510 Cove Dr Unit C12
- 10342 Independence Dr Unit 21B
- 9660 Cove Dr Unit F13
- 10364 Independence Dr Unit 19c
- 9761 Sunrise Blvd
- 9035 Wallings Rd
- 9710 Cove Dr Unit 23G
- 10560 Independence Dr Unit 25A
- 9800 Cove Dr Unit H2
- 9821 Sunrise Blvd Unit o1
- 11445 Harbour Light Dr
- 12906 Cartwright Pkwy
- 13000 Cartwright Pkwy
- 11650 Harbour Light Dr Unit 1650
- 12701 Gordon St
- 7554 Margaret Dr
- 7595 Margaret Dr
- 9757 Independence Dr Unit 1C
- 9759 Independence Dr Unit 1D
- 9759 Independence Dr Unit D-1
- 9753 Independence Dr Unit 1A
- 9853 Independence Dr Unit A
- 9859 Independence Dr Unit 3D
- 9793 Independence Dr Unit 2A
- 9795 Independence Dr
- 9795 Independence Dr Unit 2b
- 9855 Independence Dr Unit 3B
- 11798 York Rd
- 9857 Independence Dr Unit C
- 9857 Independence Dr Unit 3
- 9799 Independence Dr
- 9799 Independence Dr Unit 2D
- 9797 Independence Dr Unit 2C
- 9797 Independence Dr Unit C2
- 9899 Independence Dr
- 9899 Independence Dr Unit 5D
- 9893 Independence Dr