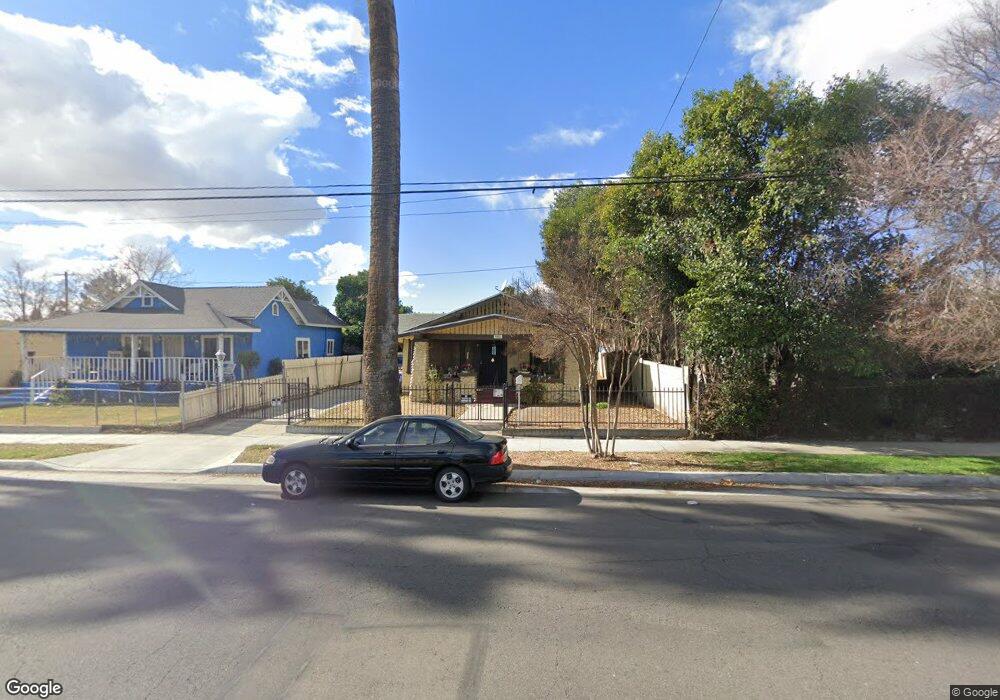
980 N F St San Bernardino, CA 92410
Hanes Park NeighborhoodEstimated Value: $308,000 - $403,000
2
Beds
1
Bath
1,198
Sq Ft
$311/Sq Ft
Est. Value
About This Home
This home is located at 980 N F St, San Bernardino, CA 92410 and is currently estimated at $372,432, approximately $310 per square foot. 980 N F St is a home located in San Bernardino County with nearby schools including Juanita Blakely Jones Elementary School, Arrowview Middle School, and Indian Springs High.
Ownership History
Date
Name
Owned For
Owner Type
Purchase Details
Closed on
Mar 31, 2014
Sold by
Cramp Jack C
Bought by
Cramp Properties Llc
Current Estimated Value
Purchase Details
Closed on
Dec 6, 2013
Sold by
Cramp Properties Lp
Bought by
Cramp Jack C and Cramp Family Living Trust
Purchase Details
Closed on
Feb 6, 1995
Sold by
Cramp Jack C and Cramp Beverly Jo
Bought by
Cramp Jack C and Cramp Beverly Jo
Create a Home Valuation Report for This Property
The Home Valuation Report is an in-depth analysis detailing your home's value as well as a comparison with similar homes in the area
Home Values in the Area
Average Home Value in this Area
Purchase History
| Date | Buyer | Sale Price | Title Company |
|---|---|---|---|
| Cramp Properties Llc | -- | None Available | |
| Callison April C | -- | None Available | |
| Cramp Jack C | -- | None Available | |
| Cramp Jack C | -- | -- |
Source: Public Records
Tax History Compared to Growth
Tax History
| Year | Tax Paid | Tax Assessment Tax Assessment Total Assessment is a certain percentage of the fair market value that is determined by local assessors to be the total taxable value of land and additions on the property. | Land | Improvement |
|---|---|---|---|---|
| 2025 | $1,149 | $79,453 | $25,453 | $54,000 |
| 2024 | $1,149 | $77,895 | $24,954 | $52,941 |
| 2023 | $1,120 | $76,368 | $24,465 | $51,903 |
| 2022 | $1,118 | $74,870 | $23,985 | $50,885 |
| 2021 | $1,116 | $73,402 | $23,515 | $49,887 |
| 2020 | $1,115 | $72,649 | $23,274 | $49,375 |
| 2019 | $1,086 | $71,225 | $22,818 | $48,407 |
| 2018 | $1,075 | $69,829 | $22,371 | $47,458 |
| 2017 | $1,042 | $68,459 | $21,932 | $46,527 |
| 2016 | $1,011 | $67,117 | $21,502 | $45,615 |
| 2015 | $879 | $66,109 | $21,179 | $44,930 |
| 2014 | $855 | $64,814 | $20,764 | $44,050 |
Source: Public Records
Map
Nearby Homes