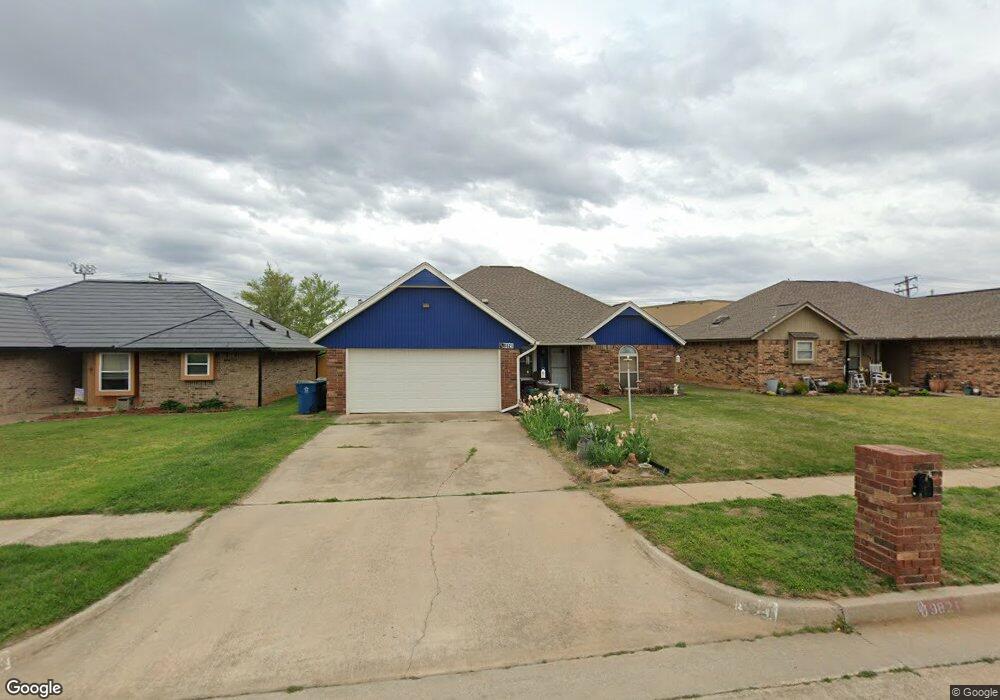
9821 Railroad Oklahoma City, OK 73130
Estimated Value: $199,085 - $224,000
3
Beds
2
Baths
1,485
Sq Ft
$141/Sq Ft
Est. Value
About This Home
This home is located at 9821 Railroad, Oklahoma City, OK 73130 and is currently estimated at $210,021, approximately $141 per square foot. 9821 Railroad is a home located in Oklahoma County with nearby schools including Carl Albert Middle School, Carl Albert High School, and Insight School of Oklahoma High School.
Ownership History
Date
Name
Owned For
Owner Type
Purchase Details
Closed on
Sep 16, 2021
Sold by
Taber Built Homes Llc
Bought by
Xk Resources Llc
Current Estimated Value
Home Financials for this Owner
Home Financials are based on the most recent Mortgage that was taken out on this home.
Original Mortgage
$110,717
Outstanding Balance
$84,511
Interest Rate
2.1%
Mortgage Type
New Conventional
Estimated Equity
$125,510
Purchase Details
Closed on
Sep 13, 2021
Sold by
Taber Built Homes Llc
Bought by
Xk Resources Llc
Home Financials for this Owner
Home Financials are based on the most recent Mortgage that was taken out on this home.
Original Mortgage
$110,717
Outstanding Balance
$84,511
Interest Rate
2.1%
Mortgage Type
New Conventional
Estimated Equity
$125,510
Purchase Details
Closed on
May 31, 2002
Sold by
Luka Ronald Lynn and Luka Deanna L
Bought by
Keeler John Scott and Keeler Robin Colleen
Create a Home Valuation Report for This Property
The Home Valuation Report is an in-depth analysis detailing your home's value as well as a comparison with similar homes in the area
Home Values in the Area
Average Home Value in this Area
Purchase History
| Date | Buyer | Sale Price | Title Company |
|---|---|---|---|
| Xk Resources Llc | $313,000 | Oklahoma City Abstract | |
| Xk Resources Llc | $313,000 | Oklahoma City Abstract & Ttl | |
| Keeler John Scott | $88,000 | American Guaranty Title Co |
Source: Public Records
Mortgage History
| Date | Status | Borrower | Loan Amount |
|---|---|---|---|
| Open | Xk Resources Llc | $110,717 | |
| Closed | Xk Resources Llc | $110,717 |
Source: Public Records
Tax History Compared to Growth
Tax History
| Year | Tax Paid | Tax Assessment Tax Assessment Total Assessment is a certain percentage of the fair market value that is determined by local assessors to be the total taxable value of land and additions on the property. | Land | Improvement |
|---|---|---|---|---|
| 2024 | $1,686 | $15,784 | $2,838 | $12,946 |
| 2023 | $1,686 | $15,325 | $2,964 | $12,361 |
| 2022 | $1,619 | $14,878 | $2,851 | $12,027 |
| 2021 | $1,606 | $14,445 | $3,194 | $11,251 |
| 2020 | $1,599 | $14,025 | $3,477 | $10,548 |
| 2019 | $1,513 | $13,879 | $2,870 | $11,009 |
| 2018 | $1,375 | $13,475 | $0 | $0 |
| 2017 | $1,378 | $13,309 | $2,968 | $10,341 |
| 2016 | $1,378 | $12,979 | $2,968 | $10,011 |
| 2015 | $1,430 | $12,936 | $2,608 | $10,328 |
| 2014 | $1,397 | $12,675 | $2,608 | $10,067 |
Source: Public Records
Map
Nearby Homes
- 9609 Rhythm Rd
- 9832 Crest Dr
- 2320 Celina Dr
- 2328 Celina Dr
- 2332 Celina Dr
- 1717 Crest Cir
- 1725 Ballad Dr
- 13985 SE 29th St
- 9317 Apple Dr
- 1704 Symphony Ln
- 9225 Apple Dr
- 10323 Haven Cir
- 9700 Woodrock Place
- 9209 Orchard Blvd
- 1917 Goldenrod Ln
- 9117 Apple Dr
- 9621 Montclaire Dr
- 10520 SE 23rd St
- 1501 S Avery Ave
- 1232 Three Oaks Cir