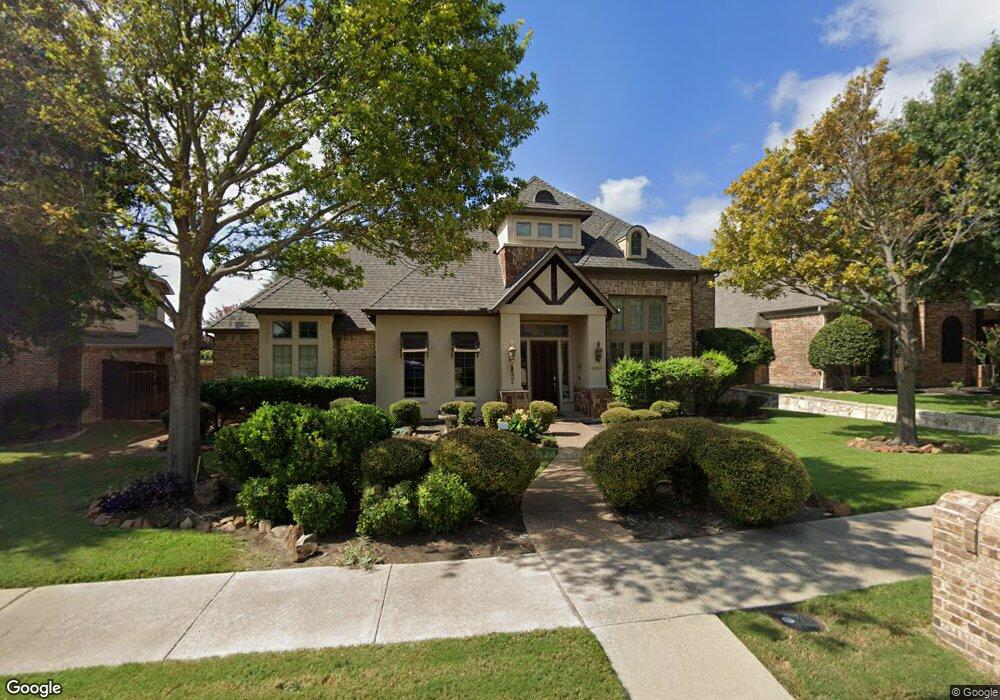
9847 Clancy Dr Frisco, TX 75035
East Frisco NeighborhoodEstimated Value: $770,000 - $850,000
4
Beds
4
Baths
4,232
Sq Ft
$189/Sq Ft
Est. Value
About This Home
This home is located at 9847 Clancy Dr, Frisco, TX 75035 and is currently estimated at $801,618, approximately $189 per square foot. 9847 Clancy Dr is a home located in Collin County with nearby schools including Tadlock Elementary School, Libby Cash Maus Middle School, and Memorial High School.
Ownership History
Date
Name
Owned For
Owner Type
Purchase Details
Closed on
Nov 28, 2023
Sold by
Rawlley Sangit and Rawlley Khushboo
Bought by
Rawlley Family Trust and Rawlley
Current Estimated Value
Purchase Details
Closed on
Jan 27, 2012
Sold by
Stolfus Lisa and Sullivan Lisa
Bought by
Rawlley Sangit S and Rawlley Khushboo Sangit
Home Financials for this Owner
Home Financials are based on the most recent Mortgage that was taken out on this home.
Original Mortgage
$307,200
Interest Rate
3.95%
Mortgage Type
New Conventional
Purchase Details
Closed on
Aug 19, 2004
Sold by
Darling Homes Of Dallas Ltd
Bought by
Sullivan Richard and Stolfus Lisa
Home Financials for this Owner
Home Financials are based on the most recent Mortgage that was taken out on this home.
Original Mortgage
$333,700
Interest Rate
5.62%
Mortgage Type
Purchase Money Mortgage
Purchase Details
Closed on
Mar 1, 2004
Sold by
Panther Creek Dallas Venture Lp
Bought by
Darling Homes Of Dallas Ltd
Create a Home Valuation Report for This Property
The Home Valuation Report is an in-depth analysis detailing your home's value as well as a comparison with similar homes in the area
Home Values in the Area
Average Home Value in this Area
Purchase History
| Date | Buyer | Sale Price | Title Company |
|---|---|---|---|
| Rawlley Family Trust | -- | None Listed On Document | |
| Rawlley Sangit S | -- | Hftc | |
| Sullivan Richard | -- | Stnt | |
| Darling Homes Of Dallas Ltd | -- | -- |
Source: Public Records
Mortgage History
| Date | Status | Borrower | Loan Amount |
|---|---|---|---|
| Previous Owner | Rawlley Sangit S | $307,200 | |
| Previous Owner | Sullivan Richard | $333,700 | |
| Closed | Darling Homes Of Dallas Ltd | $0 |
Source: Public Records
Tax History Compared to Growth
Tax History
| Year | Tax Paid | Tax Assessment Tax Assessment Total Assessment is a certain percentage of the fair market value that is determined by local assessors to be the total taxable value of land and additions on the property. | Land | Improvement |
|---|---|---|---|---|
| 2025 | $9,697 | $745,534 | $178,500 | $609,444 |
| 2024 | $9,697 | $677,758 | $178,500 | $589,709 |
| 2023 | $9,697 | $616,144 | $178,500 | $614,015 |
| 2022 | $10,604 | $560,131 | $147,000 | $569,265 |
| 2021 | $9,996 | $509,210 | $105,000 | $404,210 |
| 2020 | $9,579 | $469,331 | $105,000 | $364,331 |
| 2019 | $10,479 | $487,731 | $105,000 | $382,731 |
| 2018 | $10,618 | $487,352 | $105,000 | $382,352 |
| 2017 | $10,413 | $477,963 | $105,000 | $372,963 |
| 2016 | $9,956 | $452,638 | $99,750 | $352,888 |
| 2015 | $8,660 | $439,027 | $89,250 | $349,777 |
Source: Public Records
Map
Nearby Homes
- 12092 Ashaway Ln
- 11974 Verona Ct
- 10185 Burnt Mill Ln
- 10092 Plainsman Ln
- 12142 Lazio Ln
- 10138 Drawbridge Dr
- 10620 Bancroft Ln
- 10670 Astoria Dr
- 9849 Vickie Ln
- 10644 Bartlett Dr
- 10754 Toffenham Dr
- 12342 Salem Dr
- 12928 Sewanee Dr
- 10906 Ascot Dr
- 13121 Lanier Dr
- 10556 Midway Dr
- 13345 Anita Ct
- 11344 Corsicana Dr
- 10909 Prescott Dr
- 8313 Emerald Glen Ln
- 9865 Clancy Dr
- 9829 Clancy Dr
- 2324 Clancy Dr
- 9883 Clancy Dr
- 11970 Gladstone Ct
- 12122 Flynt Dr
- 11955 Bamberg Ln
- 9811 Clancy Dr
- 12011 Bamberg Ln
- 11947 Bamberg Ln
- 12146 Flynt Dr
- 12111 Flynt Dr
- 11985 Gladstone Ct
- 12035 Bamberg Ln
- 11952 Gladstone Ct
- 12133 Flynt Dr
- 11931 Bamberg Ln
- 11972 Bamberg Ln
- 11988 Bamberg Ln
- 11956 Bamberg Ln