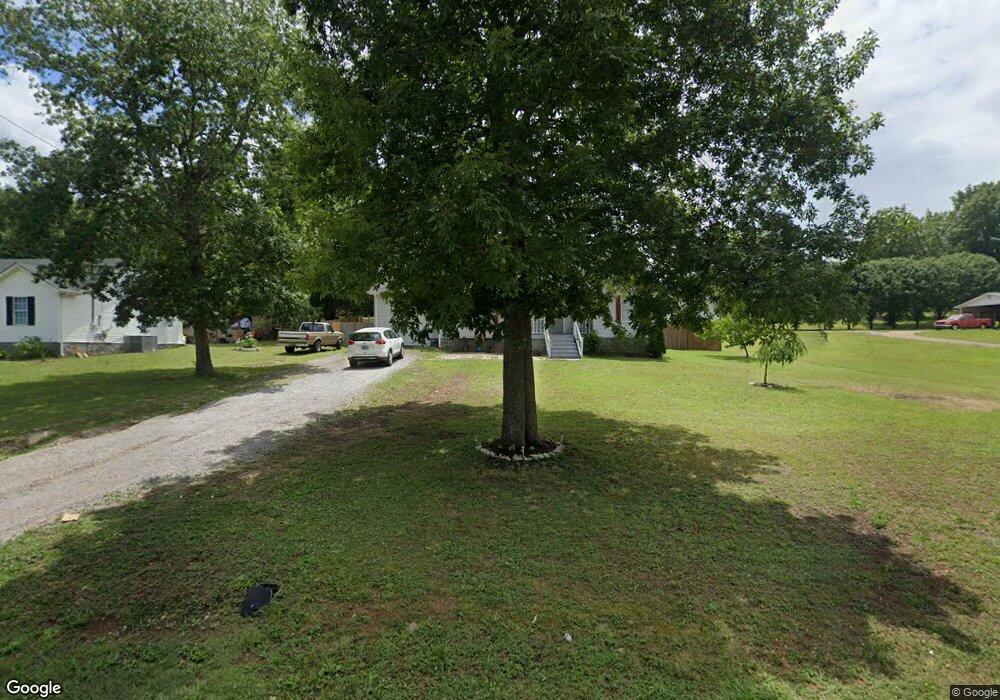
985 Cheryl Dr Lewisburg, TN 37091
Estimated Value: $259,751 - $285,000
3
Beds
2
Baths
1,174
Sq Ft
$235/Sq Ft
Est. Value
About This Home
This home is located at 985 Cheryl Dr, Lewisburg, TN 37091 and is currently estimated at $275,438, approximately $234 per square foot. 985 Cheryl Dr is a home located in Marshall County with nearby schools including Marshall Elementary School, Oak Grove Elementary School, and Westhills Elementary School.
Ownership History
Date
Name
Owned For
Owner Type
Purchase Details
Closed on
Jun 2, 2015
Sold by
Evans Cameron
Bought by
Simpson Tracy
Current Estimated Value
Purchase Details
Closed on
May 23, 2014
Sold by
Richardson Rex
Bought by
Evans Cameron and Simpson Tracy
Home Financials for this Owner
Home Financials are based on the most recent Mortgage that was taken out on this home.
Original Mortgage
$83,673
Interest Rate
4.4%
Mortgage Type
New Conventional
Purchase Details
Closed on
Mar 8, 2010
Sold by
Richardson Jody Lynn
Bought by
Richardson Rex Allen
Purchase Details
Closed on
Feb 22, 2008
Sold by
Lee Smith Lendon
Bought by
Rex Richardson
Purchase Details
Closed on
May 18, 1994
Bought by
Smith Lendon Lee and Smith Carol L
Purchase Details
Closed on
Jul 13, 1992
Bought by
David Jent and Edens Bobby
Create a Home Valuation Report for This Property
The Home Valuation Report is an in-depth analysis detailing your home's value as well as a comparison with similar homes in the area
Home Values in the Area
Average Home Value in this Area
Purchase History
| Date | Buyer | Sale Price | Title Company |
|---|---|---|---|
| Simpson Tracy | -- | -- | |
| Evans Cameron | $87,500 | -- | |
| Richardson Rex Allen | -- | -- | |
| Rex Richardson | $70,000 | -- | |
| Smith Lendon Lee | $69,000 | -- | |
| David Jent | $14,000 | -- |
Source: Public Records
Mortgage History
| Date | Status | Borrower | Loan Amount |
|---|---|---|---|
| Previous Owner | Evans Cameron | $83,673 |
Source: Public Records
Tax History Compared to Growth
Tax History
| Year | Tax Paid | Tax Assessment Tax Assessment Total Assessment is a certain percentage of the fair market value that is determined by local assessors to be the total taxable value of land and additions on the property. | Land | Improvement |
|---|---|---|---|---|
| 2024 | -- | $43,050 | $7,500 | $35,550 |
| 2023 | $1,336 | $43,050 | $7,500 | $35,550 |
| 2022 | $1,336 | $43,050 | $7,500 | $35,550 |
| 2021 | $1,193 | $25,625 | $4,500 | $21,125 |
| 2020 | $1,049 | $22,550 | $4,500 | $18,050 |
| 2019 | $1,015 | $22,550 | $4,500 | $18,050 |
| 2018 | $1,004 | $22,550 | $4,500 | $18,050 |
| 2017 | $1,004 | $22,550 | $4,500 | $18,050 |
| 2016 | $1,037 | $20,250 | $4,000 | $16,250 |
| 2015 | $946 | $20,250 | $4,000 | $16,250 |
| 2014 | $946 | $20,250 | $4,000 | $16,250 |
Source: Public Records
Map
Nearby Homes
- 104 Mackenzie Way
- MEDFORD Plan at King's Landing
- 1205 Maelee Ann Dr
- 125 Southview Dr
- 103 Mackenzie Way
- 147 Mackenzie Way
- 198 Southview Dr
- 149 Mackenzie Way
- 151 Mackenzie Way
- 153 Mackenzie Way
- 155 Mackenzie Way
- 157 Mackenzie Way
- 159 Mackenzie Way
- 301 Weston Dr
- 1011 Cornersville Rd
- 1235 Yell Rd
- 185 Southview Dr
- 1128 Moreno Ln
- 313 Pardo Dr
- 1361 Yell Rd