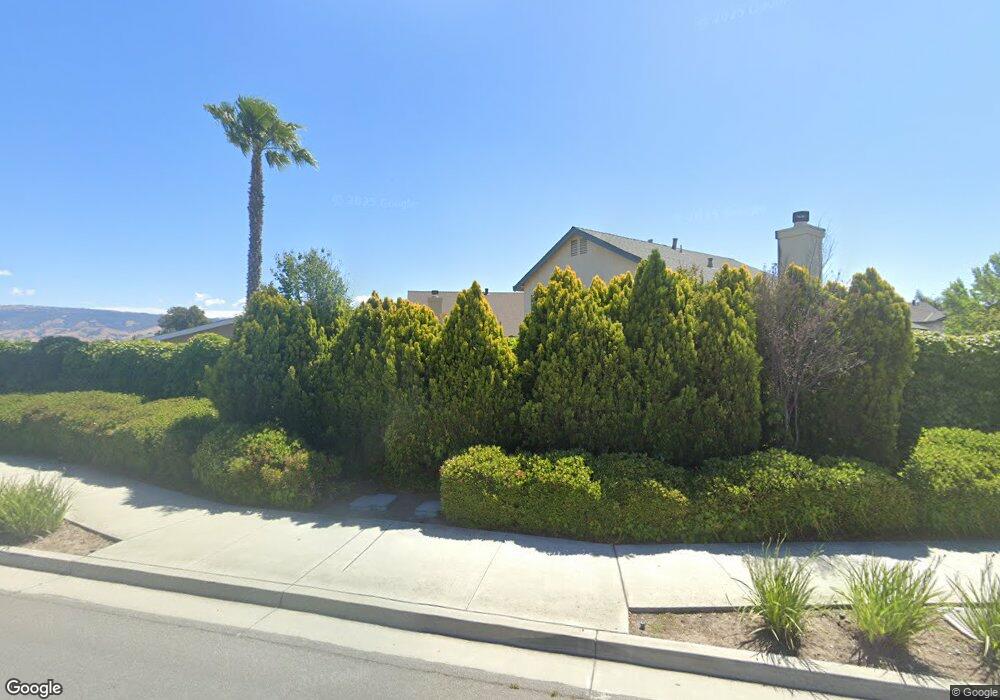
991 Woodcreek Way Gilroy, CA 95020
Las Animas NeighborhoodEstimated Value: $946,000 - $1,206,917
4
Beds
3
Baths
2,536
Sq Ft
$422/Sq Ft
Est. Value
About This Home
This home is located at 991 Woodcreek Way, Gilroy, CA 95020 and is currently estimated at $1,070,229, approximately $422 per square foot. 991 Woodcreek Way is a home located in Santa Clara County with nearby schools including Solorsano Middle School, South Valley Middle School, and Christopher High School.
Ownership History
Date
Name
Owned For
Owner Type
Purchase Details
Closed on
Aug 31, 2016
Sold by
Raee Najeed and Khan Ambareen R
Bought by
Raee Najeed and Khan Ambareen R
Current Estimated Value
Purchase Details
Closed on
Nov 10, 2011
Sold by
Pnmac Mortgage Co Llc
Bought by
Raee Najeed and Khan Ambareen R
Home Financials for this Owner
Home Financials are based on the most recent Mortgage that was taken out on this home.
Original Mortgage
$327,750
Outstanding Balance
$222,520
Interest Rate
3.93%
Mortgage Type
New Conventional
Estimated Equity
$847,709
Purchase Details
Closed on
Aug 5, 2011
Sold by
Altramirano Lawrence B and Altamirano Lynette B
Bought by
Pnmac Mortgage Co Llc
Purchase Details
Closed on
Jun 22, 1998
Sold by
Longmeadow Drive Associates
Bought by
Altamirano Lawrence B and Altamirano Lynette B
Home Financials for this Owner
Home Financials are based on the most recent Mortgage that was taken out on this home.
Original Mortgage
$195,111
Interest Rate
7.17%
Create a Home Valuation Report for This Property
The Home Valuation Report is an in-depth analysis detailing your home's value as well as a comparison with similar homes in the area
Home Values in the Area
Average Home Value in this Area
Purchase History
| Date | Buyer | Sale Price | Title Company |
|---|---|---|---|
| Raee Najeed | -- | None Available | |
| Raee Najeed | $345,000 | Lsi Title Company | |
| Pnmac Mortgage Co Llc | $340,000 | Accommodation | |
| Altamirano Lawrence B | $205,500 | Chicago Title |
Source: Public Records
Mortgage History
| Date | Status | Borrower | Loan Amount |
|---|---|---|---|
| Open | Raee Najeed | $327,750 | |
| Previous Owner | Altamirano Lawrence B | $195,111 |
Source: Public Records
Tax History Compared to Growth
Tax History
| Year | Tax Paid | Tax Assessment Tax Assessment Total Assessment is a certain percentage of the fair market value that is determined by local assessors to be the total taxable value of land and additions on the property. | Land | Improvement |
|---|---|---|---|---|
| 2025 | $7,250 | $600,000 | $173,330 | $426,670 |
| 2024 | $7,250 | $588,236 | $169,932 | $418,304 |
| 2023 | $7,206 | $576,702 | $166,600 | $410,102 |
| 2022 | $7,086 | $565,395 | $163,334 | $402,061 |
| 2021 | $7,053 | $554,310 | $160,132 | $394,178 |
| 2020 | $6,975 | $548,628 | $158,491 | $390,137 |
| 2019 | $6,754 | $524,360 | $155,384 | $368,976 |
| 2018 | $4,754 | $380,844 | $152,338 | $228,506 |
| 2017 | $4,853 | $373,377 | $149,351 | $224,026 |
| 2016 | $4,664 | $366,057 | $146,423 | $219,634 |
| 2015 | $4,400 | $360,559 | $144,224 | $216,335 |
| 2014 | $4,371 | $353,497 | $141,399 | $212,098 |
Source: Public Records
Map
Nearby Homes
- 820 Woodcreek Way
- 9632 Cherrywood Ct
- 1080 Sunrise Dr
- 670 Wickham Ct
- 1206 Sycamore Ct
- 264 Windsong Way
- 1486 Swallow Ln
- 1469 Goshawk Ct
- 1469 Eagles Nest Ln
- 1482 Goshawk Ct
- 9850 Bobcat Ct
- 1297 Chesbro Way
- 9135 Desiderio Way
- 119 Farrell Ave
- 103 Farrell Ave
- 111 Farrell Ave
- 1620 Welburn Ave
- 796 Gary St
- 8940 Acorn Way
- 9232 Kestrel Ct
- 985 Summerhill Cir
- 981 Woodcreek Way
- 961 Woodcreek Way
- 975 Summerhill Cir
- 960 Summerhill Cir
- 951 Woodcreek Way
- 955 Summerhill Cir
- 940 Summerhill Cir
- 931 Woodcreek Way
- 905 Summerhill Cir
- 935 Summerhill Cir
- 915 Summerhill Cir
- 921 Woodcreek Way
- 9330 Benbow Dr
- 9320 Benbow Dr
- 9340 Benbow Dr
- 9310 Benbow Dr
- 9300 Benbow Dr
- 9350 Benbow Dr
- 911 Woodcreek Way