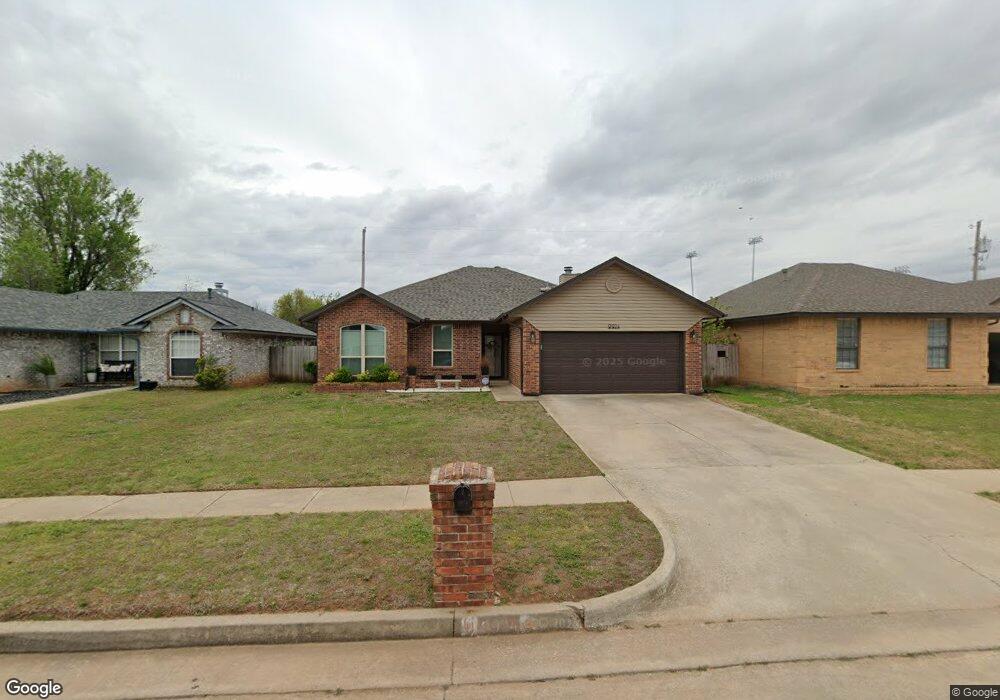
9924 Railroad Oklahoma City, OK 73130
Estimated Value: $202,953 - $213,000
3
Beds
2
Baths
1,554
Sq Ft
$133/Sq Ft
Est. Value
About This Home
This home is located at 9924 Railroad, Oklahoma City, OK 73130 and is currently estimated at $207,238, approximately $133 per square foot. 9924 Railroad is a home located in Oklahoma County with nearby schools including Carl Albert Middle School, Carl Albert High School, and Insight School of Oklahoma High School.
Ownership History
Date
Name
Owned For
Owner Type
Purchase Details
Closed on
Aug 29, 2007
Sold by
Rayburn Kevin N and Rayburn Talisha
Bought by
Oldham Lori A
Current Estimated Value
Home Financials for this Owner
Home Financials are based on the most recent Mortgage that was taken out on this home.
Original Mortgage
$100,131
Outstanding Balance
$63,817
Interest Rate
6.7%
Mortgage Type
Purchase Money Mortgage
Estimated Equity
$143,421
Purchase Details
Closed on
Jun 25, 2002
Sold by
Fox Donald L
Bought by
Rayburn Kevin N
Purchase Details
Closed on
Dec 26, 2001
Sold by
Fox Donald L and Fox Elizabeth S
Bought by
Fox Donald L
Purchase Details
Closed on
Jun 16, 2000
Sold by
White Darryle Evans and White Marvenette
Bought by
Fox Donald L
Home Financials for this Owner
Home Financials are based on the most recent Mortgage that was taken out on this home.
Original Mortgage
$65,000
Interest Rate
8.5%
Create a Home Valuation Report for This Property
The Home Valuation Report is an in-depth analysis detailing your home's value as well as a comparison with similar homes in the area
Home Values in the Area
Average Home Value in this Area
Purchase History
| Date | Buyer | Sale Price | Title Company |
|---|---|---|---|
| Oldham Lori A | $112,500 | Stewart Escrow & Title Midwe | |
| Rayburn Kevin N | $89,500 | Stewart Escrow & Title | |
| Fox Donald L | -- | -- | |
| Fox Donald L | $87,000 | Green Country Title & Escrow |
Source: Public Records
Mortgage History
| Date | Status | Borrower | Loan Amount |
|---|---|---|---|
| Open | Oldham Lori A | $100,131 | |
| Previous Owner | Fox Donald L | $65,000 |
Source: Public Records
Tax History Compared to Growth
Tax History
| Year | Tax Paid | Tax Assessment Tax Assessment Total Assessment is a certain percentage of the fair market value that is determined by local assessors to be the total taxable value of land and additions on the property. | Land | Improvement |
|---|---|---|---|---|
| 2024 | $1,764 | $16,465 | $2,458 | $14,007 |
| 2023 | $1,764 | $15,985 | $2,535 | $13,450 |
| 2022 | $1,694 | $15,520 | $2,455 | $13,065 |
| 2021 | $1,680 | $15,068 | $2,751 | $12,317 |
| 2020 | $1,673 | $14,630 | $2,992 | $11,638 |
| 2019 | $1,586 | $14,502 | $2,466 | $12,036 |
| 2018 | $1,442 | $14,080 | $0 | $0 |
| 2017 | $1,440 | $13,859 | $2,554 | $11,305 |
| 2016 | $1,442 | $13,529 | $2,554 | $10,975 |
| 2015 | $1,518 | $13,668 | $2,608 | $11,060 |
| 2014 | $1,485 | $13,407 | $2,608 | $10,799 |
Source: Public Records
Map
Nearby Homes
- 2320 Celina Dr
- 2328 Celina Dr
- 2332 Celina Dr
- 9832 Crest Dr
- 13985 SE 29th St
- 9609 Rhythm Rd
- 1717 Crest Cir
- 10323 Haven Cir
- 1725 Ballad Dr
- 10520 SE 23rd St
- 1917 Goldenrod Ln
- 9317 Apple Dr
- 1704 Symphony Ln
- 10553 SE 23rd St
- 2402 Cattail Cir
- 2332 Snapper Ln
- 9700 Woodrock Place
- 1501 S Avery Ave
- 9225 Apple Dr
- 2708 Snapper Ln