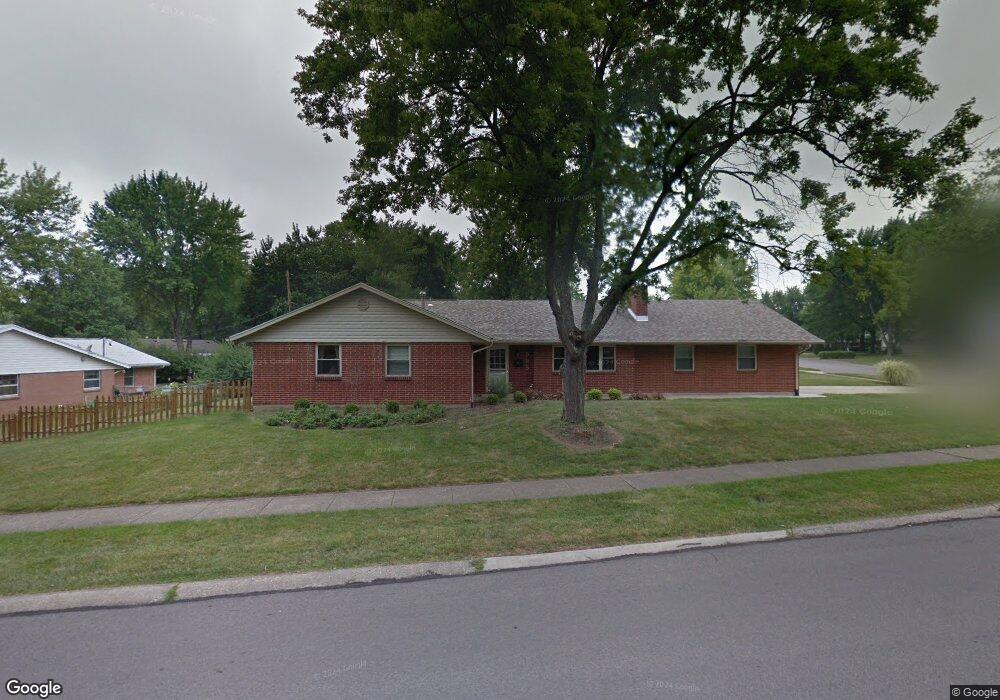
995 Pepper Hill Dr Dayton, OH 45429
Estimated Value: $395,254
4
Beds
2
Baths
2,110
Sq Ft
$187/Sq Ft
Est. Value
About This Home
This home is located at 995 Pepper Hill Dr, Dayton, OH 45429 and is currently estimated at $395,254, approximately $187 per square foot. 995 Pepper Hill Dr is a home located in Montgomery County with nearby schools including John F. Kennedy Elementary School, Kettering Middle School, and Kettering Fairmont High School.
Ownership History
Date
Name
Owned For
Owner Type
Purchase Details
Closed on
Apr 7, 2010
Sold by
Sanders William D and Sanders Angelia T
Bought by
Miami Valley Inovations Inc
Current Estimated Value
Home Financials for this Owner
Home Financials are based on the most recent Mortgage that was taken out on this home.
Original Mortgage
$172,000
Outstanding Balance
$114,615
Interest Rate
5.01%
Mortgage Type
Commercial
Estimated Equity
$280,639
Purchase Details
Closed on
Apr 21, 2008
Sold by
Carson Richard A and Carson Judy L
Bought by
Sanders William D and Sanders Angela T
Home Financials for this Owner
Home Financials are based on the most recent Mortgage that was taken out on this home.
Original Mortgage
$155,700
Interest Rate
5.88%
Mortgage Type
Commercial
Purchase Details
Closed on
May 18, 2006
Sold by
Lukacs Matthew J
Bought by
Carson Richard A and Carson Judy L
Create a Home Valuation Report for This Property
The Home Valuation Report is an in-depth analysis detailing your home's value as well as a comparison with similar homes in the area
Home Values in the Area
Average Home Value in this Area
Purchase History
| Date | Buyer | Sale Price | Title Company |
|---|---|---|---|
| Miami Valley Inovations Inc | $172,000 | Attorney | |
| Sanders William D | $173,000 | Attorney | |
| Carson Richard A | $118,700 | None Available |
Source: Public Records
Mortgage History
| Date | Status | Borrower | Loan Amount |
|---|---|---|---|
| Open | Miami Valley Inovations Inc | $172,000 | |
| Previous Owner | Sanders William D | $155,700 |
Source: Public Records
Tax History Compared to Growth
Tax History
| Year | Tax Paid | Tax Assessment Tax Assessment Total Assessment is a certain percentage of the fair market value that is determined by local assessors to be the total taxable value of land and additions on the property. | Land | Improvement |
|---|---|---|---|---|
| 2024 | $40 | $64,950 | $8,850 | $56,100 |
| 2023 | $40 | $64,950 | $8,850 | $56,100 |
| 2022 | $23 | $64,950 | $8,850 | $56,100 |
| 2021 | $23 | $64,950 | $8,850 | $56,100 |
| 2020 | $23 | $64,950 | $8,850 | $56,100 |
| 2019 | $23 | $51,320 | $8,850 | $42,470 |
| 2018 | $23 | $51,320 | $8,850 | $42,470 |
| 2017 | $23 | $51,320 | $8,850 | $42,470 |
| 2016 | $23 | $48,320 | $8,850 | $39,470 |
| 2015 | $23 | $48,320 | $8,850 | $39,470 |
| 2014 | $23 | $48,320 | $8,850 | $39,470 |
| 2012 | -- | $50,860 | $9,850 | $41,010 |
Source: Public Records
Map
Nearby Homes
- 4817 Ackerman Blvd
- 1049 Georgian Dr
- 5017 Ackerman Blvd
- 617 Laurelann Dr
- 501 Judith Dr
- 321 Princewood Ave
- 1008 Rio Ln
- 804 Lovetta Dr
- 4640 Marshall Rd
- 1033 Carlo Dr
- 730 Hyde Park Dr
- 5155 Marshall Rd
- 1310 Partridge Run Cir Unit 1310
- 4816 Judith Dr
- 4808 Judith Dr
- 791 Willowdale Ave
- 101 Enid Ave
- 5328 Landau Dr Unit 49
- 5328 Landau Dr
- 4824 Far Hills Ave
- 4741 Eagleview Dr
- 979 Pepper Hill Dr
- 4733 Eagleview Dr
- 996 Pepper Hill Dr
- 1004 Pepper Hill Dr
- 4740 Eagleview Dr
- 4740 Shady Hill Ln
- 4756 Shady Hill Ln
- 988 Pepper Hill Dr
- 1012 Pepper Hill Dr
- 958 Pepper Hill Dr
- 4725 Eagleview Dr
- 1019 Pepper Hill Dr
- 1020 Pepper Hill Dr
- 4808 Shady Hill Ln
- 4724 Shady Hill Ln
- 4724 Eagleview Dr
- 983 Independence Dr
- 975 Independence Dr
- 4717 Eagleview Dr