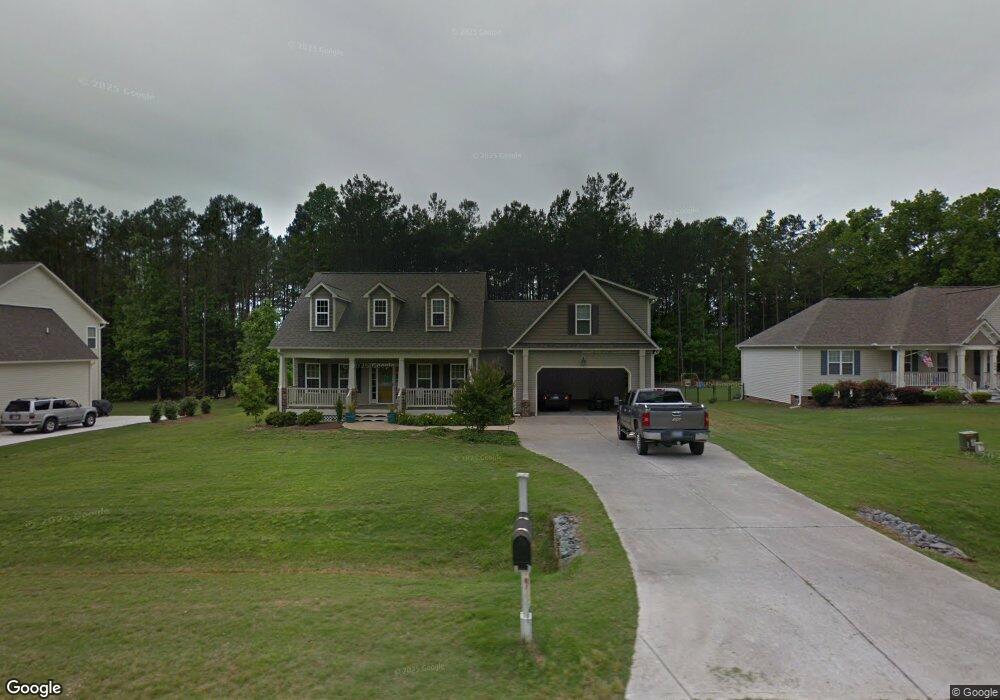
996 Contender Dr Clayton, NC 27520
Estimated Value: $454,248 - $496,000
3
Beds
3
Baths
2,668
Sq Ft
$177/Sq Ft
Est. Value
About This Home
This home is located at 996 Contender Dr, Clayton, NC 27520 and is currently estimated at $471,312, approximately $176 per square foot. 996 Contender Dr is a home located in Johnston County with nearby schools including Polenta Elementary School, Swift Creek Middle, and Cleveland High School.
Ownership History
Date
Name
Owned For
Owner Type
Purchase Details
Closed on
Feb 11, 2018
Sold by
Quinn Lindsay Powell and Quinn Andrew
Bought by
Clayton William A and Clayton Rhonda L
Current Estimated Value
Home Financials for this Owner
Home Financials are based on the most recent Mortgage that was taken out on this home.
Original Mortgage
$177,500
Outstanding Balance
$151,296
Interest Rate
4.25%
Mortgage Type
Adjustable Rate Mortgage/ARM
Estimated Equity
$320,016
Purchase Details
Closed on
Feb 10, 2014
Sold by
Danchak Maryellen and Danchak Mary Ellen
Bought by
Quinn Lindsay Powell
Purchase Details
Closed on
Jun 17, 2010
Sold by
Golden Properties & Development Inc
Bought by
Danchak Maryellen
Home Financials for this Owner
Home Financials are based on the most recent Mortgage that was taken out on this home.
Original Mortgage
$230,805
Interest Rate
4.75%
Mortgage Type
FHA
Purchase Details
Closed on
Apr 23, 2008
Sold by
Son Lan Ldl Llc
Bought by
Lee Ron R
Create a Home Valuation Report for This Property
The Home Valuation Report is an in-depth analysis detailing your home's value as well as a comparison with similar homes in the area
Home Values in the Area
Average Home Value in this Area
Purchase History
| Date | Buyer | Sale Price | Title Company |
|---|---|---|---|
| Clayton William A | $277,500 | None Available | |
| Quinn Lindsay Powell | $218,500 | None Available | |
| Danchak Maryellen | $234,000 | None Available | |
| Lee Ron R | -- | None Available |
Source: Public Records
Mortgage History
| Date | Status | Borrower | Loan Amount |
|---|---|---|---|
| Open | Clayton William A | $177,500 | |
| Previous Owner | Danchak Maryellen | $230,805 |
Source: Public Records
Tax History Compared to Growth
Tax History
| Year | Tax Paid | Tax Assessment Tax Assessment Total Assessment is a certain percentage of the fair market value that is determined by local assessors to be the total taxable value of land and additions on the property. | Land | Improvement |
|---|---|---|---|---|
| 2025 | $2,910 | $458,280 | $80,000 | $378,280 |
| 2024 | $2,346 | $289,630 | $42,000 | $247,630 |
| 2023 | $2,230 | $289,630 | $42,000 | $247,630 |
| 2022 | $2,288 | $289,630 | $42,000 | $247,630 |
| 2021 | $2,288 | $289,630 | $42,000 | $247,630 |
| 2020 | $2,375 | $289,630 | $42,000 | $247,630 |
| 2019 | $2,375 | $289,630 | $42,000 | $247,630 |
| 2018 | $2,160 | $257,110 | $33,000 | $224,110 |
| 2017 | $2,160 | $257,110 | $33,000 | $224,110 |
| 2016 | $1,864 | $221,950 | $33,000 | $188,950 |
| 2015 | $1,864 | $221,950 | $33,000 | $188,950 |
| 2014 | $1,864 | $221,950 | $33,000 | $188,950 |
Source: Public Records
Map
Nearby Homes
- 109 Fountain Dr
- 346 Silver Creek Dr
- 391 Crystal Creek Dr
- 2005 Mooregate Ct
- 60 Branding Iron Dr
- 433 Steel Bridge Rd
- 75 Santa Gertrudis Dr
- 386 Rising Star Dr
- 52 Quail Point Cir
- 380 Cooper Branch Rd
- 79 Quail Point Cir
- Colfax Plan at High Springs
- Cooper Plan at High Springs
- Raleigh Plan at High Springs
- Davidson Plan at High Springs
- Cypress Plan at High Springs
- Wescott Plan at High Springs
- Asheboro Plan at High Springs
- McDowell Plan at High Springs
- 328 Avery Meadows Dr
- 1008 Contender Dr Unit CARSO
- 108 Contender Dr
- 984 Contender Dr
- 1024 Contender Dr
- 962 Contender Dr
- 35 Regulator Dr
- 53 Regulator Dr
- 995 Contender Dr
- 1009 Contender Dr
- 1009 Contender Dr Unit Carlo
- 983 Contender Dr
- 940 Contender Dr
- 1038 Contender Dr Unit LEESV
- 1021 Contender Dr Unit HAMPT
- 61 Regulator Dr
- 963 Contender Dr
- 23 Regulator Dr
- 1033 Contender Dr
- 939 Contender Dr
- 11 Regulator Dr