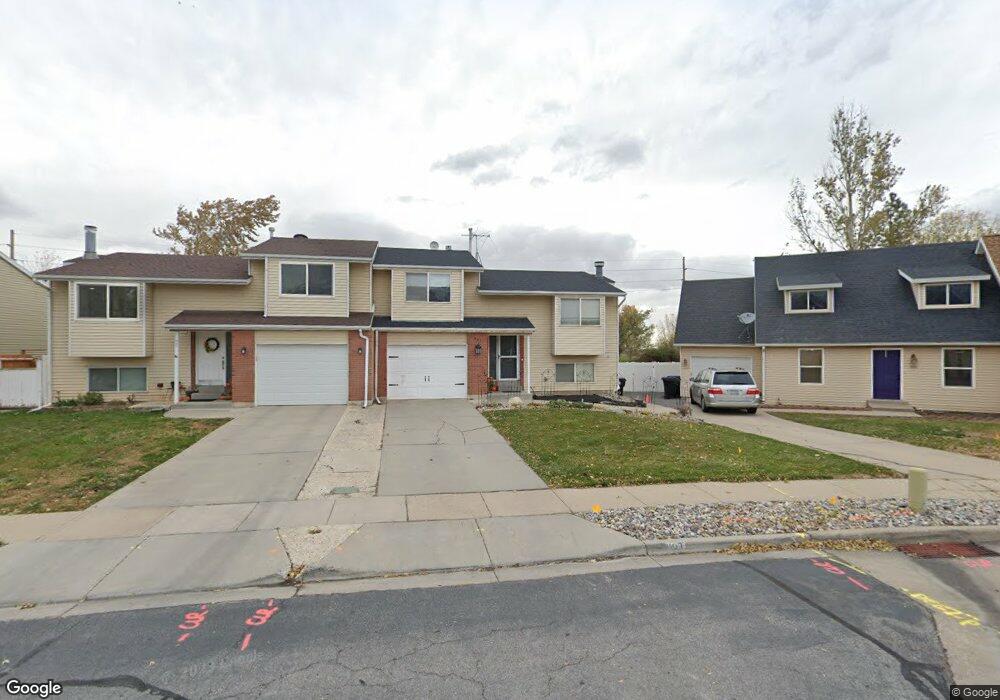
999 N 900 W West Bountiful, UT 84087
Estimated Value: $387,436 - $410,000
3
Beds
2
Baths
1,139
Sq Ft
$346/Sq Ft
Est. Value
About This Home
This home is located at 999 N 900 W, West Bountiful, UT 84087 and is currently estimated at $394,109, approximately $346 per square foot. 999 N 900 W is a home located in Davis County with nearby schools including West Bountiful Elementary School, Bountiful Junior High School, and Viewmont High School.
Ownership History
Date
Name
Owned For
Owner Type
Purchase Details
Closed on
Aug 24, 2023
Sold by
Walker Daniel Jared
Bought by
Daniel And Sharlyn Walker Revocable Trust and Walker
Current Estimated Value
Purchase Details
Closed on
Sep 17, 2021
Sold by
Dolan Michael A
Bought by
Walker Daniel Jared
Home Financials for this Owner
Home Financials are based on the most recent Mortgage that was taken out on this home.
Original Mortgage
$332,120
Interest Rate
2.7%
Mortgage Type
New Conventional
Purchase Details
Closed on
Aug 8, 2006
Sold by
Jones Chad A and Jones Adrienne
Bought by
Dolan Michael A
Home Financials for this Owner
Home Financials are based on the most recent Mortgage that was taken out on this home.
Original Mortgage
$106,860
Interest Rate
6.69%
Mortgage Type
New Conventional
Purchase Details
Closed on
May 10, 2002
Sold by
Jones Chad A
Bought by
Jones Chad A and Jones Adrienne
Create a Home Valuation Report for This Property
The Home Valuation Report is an in-depth analysis detailing your home's value as well as a comparison with similar homes in the area
Home Values in the Area
Average Home Value in this Area
Purchase History
| Date | Buyer | Sale Price | Title Company |
|---|---|---|---|
| Daniel And Sharlyn Walker Revocable Trust | -- | None Listed On Document | |
| Walker Daniel Jared | -- | Meraki Title Insurance | |
| Dolan Michael A | -- | Heritage West Title Ins Agen | |
| Jones Chad A | -- | Associated Title Company | |
| Jones Chad A | -- | Associated Title Company |
Source: Public Records
Mortgage History
| Date | Status | Borrower | Loan Amount |
|---|---|---|---|
| Previous Owner | Walker Daniel Jared | $332,120 | |
| Previous Owner | Dolan Michael A | $106,860 | |
| Previous Owner | Dolan Michael A | $26,715 |
Source: Public Records
Tax History Compared to Growth
Tax History
| Year | Tax Paid | Tax Assessment Tax Assessment Total Assessment is a certain percentage of the fair market value that is determined by local assessors to be the total taxable value of land and additions on the property. | Land | Improvement |
|---|---|---|---|---|
| 2025 | $2,278 | $192,500 | $133,031 | $59,469 |
| 2024 | $2,143 | $185,900 | $109,204 | $76,696 |
| 2023 | $2,094 | $335,000 | $207,950 | $127,050 |
| 2022 | $2,042 | $182,600 | $0 | $182,600 |
| 2021 | $1,867 | $256,000 | $36,000 | $220,000 |
| 2020 | $1,643 | $222,000 | $35,400 | $186,600 |
| 2019 | $1,589 | $213,000 | $34,000 | $179,000 |
| 2018 | $1,504 | $199,000 | $34,000 | $165,000 |
| 2016 | $1,181 | $84,920 | $18,700 | $66,220 |
| 2015 | $1,105 | $75,625 | $18,700 | $56,925 |
| 2014 | $1,205 | $85,585 | $26,921 | $58,664 |
| 2013 | -- | $76,579 | $24,847 | $51,732 |
Source: Public Records
Map
Nearby Homes
- 825 W 1320 N
- 1084 W Audrey Ln Unit 20
- 1084 W Audrey Ln
- 637 W 1600 N
- 767 W 220 N
- 280 N 1100 W
- 789 W 1950 N
- 790 N 500 W
- 988 W 1950 N Unit 134
- 366 W 1000 N
- 2035 N 800 W
- Lincoln Farmhouse Plan at Belmont Farms
- Belmont Traditional Plan at Belmont Farms
- Hampton Traditional Plan at Belmont Farms
- 340 N 500 W Unit 204
- 399 W 400 N Unit 47
- 1503 N 300 W
- 2257 N 830 W
- Carson Plan at Amberly Place
- 2050 Farmhouse Plan at Amberly Place