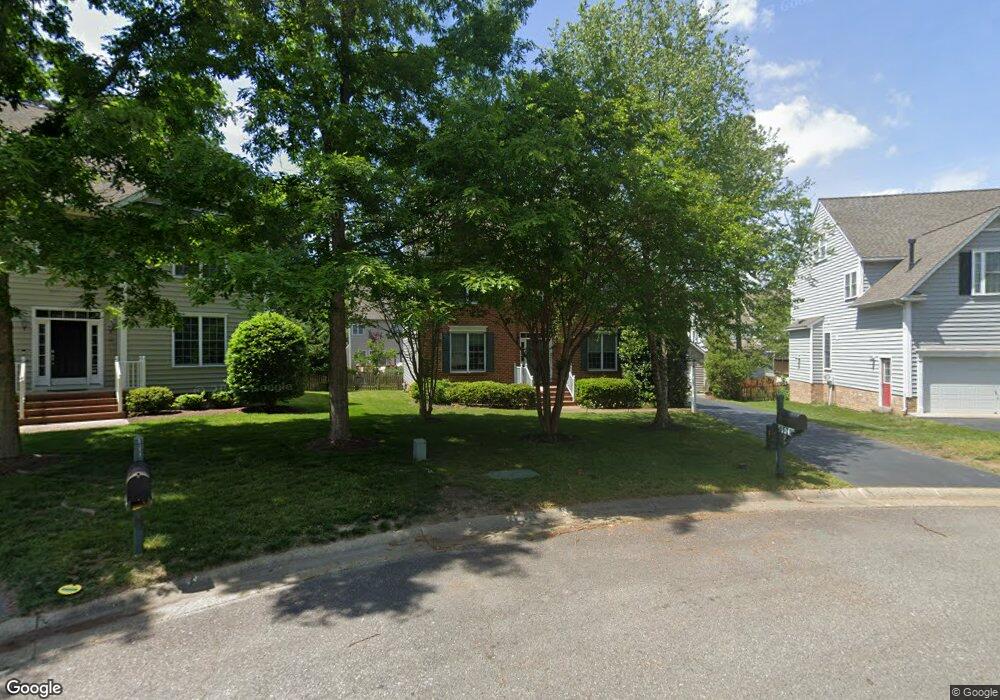
LOT 6B - 5104 Amberwood Cir Glen Allen, VA 23059
Short Pump Neighborhood
4
Beds
4
Baths
3,349
Sq Ft
--
Built
About This Home
This home is located at LOT 6B - 5104 Amberwood Cir, Glen Allen, VA 23059. LOT 6B - 5104 Amberwood Cir is a home located in Henrico County with nearby schools including Colonial Trail Elementary School, Short Pump Middle School, and Deep Run High School.
Ownership History
Date
Name
Owned For
Owner Type
Purchase Details
Closed on
Jul 20, 2021
Sold by
Mallory John T and Mallory Julie G
Bought by
Wallace Timothy J and Choudhury Jennifer D
Home Financials for this Owner
Home Financials are based on the most recent Mortgage that was taken out on this home.
Original Mortgage
$572,500
Outstanding Balance
$517,444
Interest Rate
2.93%
Mortgage Type
New Conventional
Purchase Details
Closed on
Apr 15, 2005
Sold by
Butler Mary
Bought by
Mallory John
Home Financials for this Owner
Home Financials are based on the most recent Mortgage that was taken out on this home.
Original Mortgage
$218,000
Interest Rate
5.78%
Mortgage Type
New Conventional
Purchase Details
Closed on
Jan 11, 2005
Sold by
H H Hunt Homes L L C
Bought by
Butler Mary and Gallagher,Donna
Home Financials for this Owner
Home Financials are based on the most recent Mortgage that was taken out on this home.
Original Mortgage
$364,500
Interest Rate
5.71%
Mortgage Type
New Conventional
Create a Home Valuation Report for This Property
The Home Valuation Report is an in-depth analysis detailing your home's value as well as a comparison with similar homes in the area
Home Values in the Area
Average Home Value in this Area
Purchase History
| Date | Buyer | Sale Price | Title Company |
|---|---|---|---|
| Wallace Timothy J | $572,500 | Attorney | |
| Mallory John | $429,900 | -- | |
| Butler Mary | $406,534 | -- |
Source: Public Records
Mortgage History
| Date | Status | Borrower | Loan Amount |
|---|---|---|---|
| Open | Wallace Timothy J | $572,500 | |
| Previous Owner | Mallory John | $218,000 | |
| Previous Owner | Butler Mary | $364,500 |
Source: Public Records
Tax History Compared to Growth
Tax History
| Year | Tax Paid | Tax Assessment Tax Assessment Total Assessment is a certain percentage of the fair market value that is determined by local assessors to be the total taxable value of land and additions on the property. | Land | Improvement |
|---|---|---|---|---|
| 2025 | $5,532 | $635,200 | $160,000 | $475,200 |
| 2024 | $5,532 | $612,300 | $160,000 | $452,300 |
| 2023 | $5,205 | $612,300 | $160,000 | $452,300 |
| 2022 | $4,228 | $497,400 | $140,000 | $357,400 |
| 2021 | $4,006 | $446,400 | $120,000 | $326,400 |
| 2020 | $3,884 | $446,400 | $120,000 | $326,400 |
| 2019 | $3,797 | $436,400 | $110,000 | $326,400 |
| 2018 | $3,677 | $422,600 | $110,000 | $312,600 |
| 2017 | $3,602 | $414,000 | $110,000 | $304,000 |
| 2016 | $3,602 | $414,000 | $110,000 | $304,000 |
| 2015 | $3,651 | $436,800 | $110,000 | $326,800 |
| 2014 | $3,651 | $419,700 | $110,000 | $309,700 |
Source: Public Records
Map
Nearby Homes
- 4501 Hickory Lake Ct
- 606 Haven Mews Cir
- 5309 Twisting Vine Ln Unit 105
- 5309 Twisting Vine Ln Unit 202
- 5309 Twisting Vine Ln Unit 104
- 5309 Twisting Vine Ln Unit 203
- 5309 Twisting Vine Ln Unit 205
- 5309 Twisting Vine Ln Unit 103
- 5309 Twisting Vine Ln Unit 204
- 5309 Twisting Vine Ln Unit 201
- 5309 Twisting Vine Ln Unit 102
- 5309 Twisting Vine Ln Unit 101
- 5304 Twisting Vine Ln Unit 102
- 5304 Twisting Vine Ln Unit 203
- Kent Plan at The Pointe at Twin Hickory - Smart Living
- Bristol 2 Plan at The Pointe at Twin Hickory - Smart Living
- York Plan at The Pointe at Twin Hickory - Smart Living
- Penhurst Plan at The Pointe at Twin Hickory - Smart Living
- Bristol 1 Plan at The Pointe at Twin Hickory - Smart Living
- Hayes 1 Comfort Plan at The Pointe at Twin Hickory - Smart Living
- 5104 Amberwood Cir
- 5100 Amberwood Cir
- 12005 Amberwood Ln
- 12005 Amberwood Ln
- 12001 Amberwood Ln
- 12009 Amberwood Ln
- 12009 Amberwood Ln
- LOT 5B- 5108 Amberwood Cir
- 5108 Amberwood Cir
- 12013 Amberwood Ln
- 5020 Amberwood Cir
- 11921 Amberwood Ln
- 5112 Amberwood Cir
- 12017 Amberwood Ln
- 12021 Amberwood Ln
- 11917 Amberwood Ln
- 5016 Amberwood Cir
- 5116 Amberwood Cir
- 5124 Amberwood Cir
- 5005 Amberwood Dr