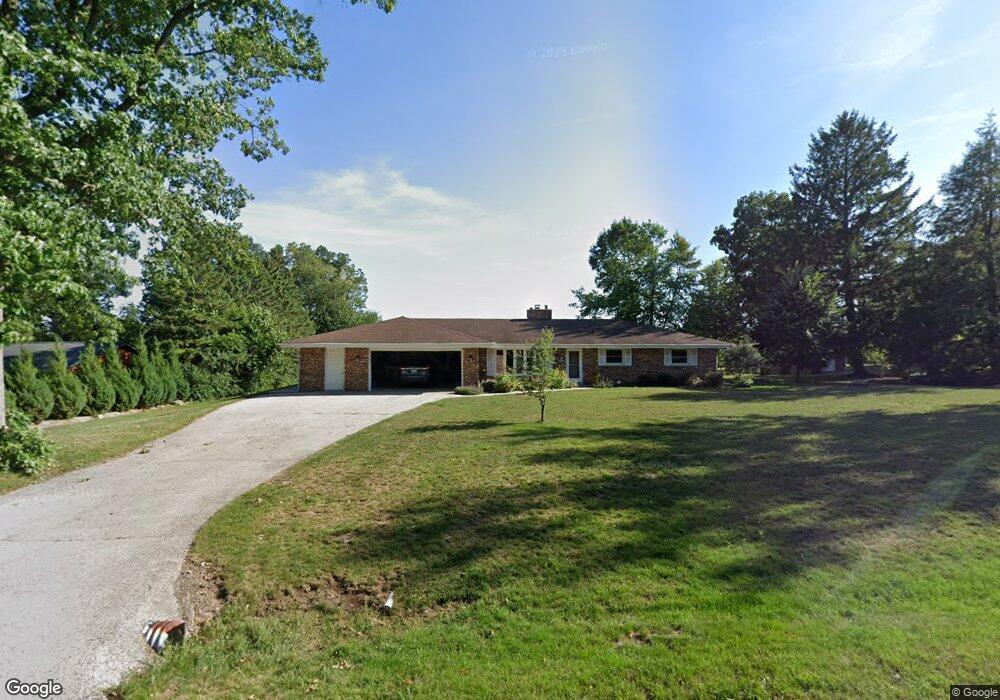
N79W25065 Hickory View Ln Sussex, WI 53089
Estimated Value: $433,277 - $506,000
--
Bed
--
Bath
--
Sq Ft
--
Built
About This Home
This home is located at N79W25065 Hickory View Ln, Sussex, WI 53089 and is currently estimated at $463,319. N79W25065 Hickory View Ln is a home located in Waukesha County with nearby schools including Maple Avenue Elementary School, Templeton Middle School, and Hamilton High School.
Ownership History
Date
Name
Owned For
Owner Type
Purchase Details
Closed on
Mar 30, 2018
Sold by
Hibler Christopher John
Bought by
Schmitt Doreen L and Schmitt Eugene P
Current Estimated Value
Purchase Details
Closed on
Jul 24, 2017
Sold by
Hibler Christopher John and Hibler Tracie Ann
Bought by
Hibler Christopher John
Home Financials for this Owner
Home Financials are based on the most recent Mortgage that was taken out on this home.
Original Mortgage
$237,847
Interest Rate
3.9%
Mortgage Type
New Conventional
Purchase Details
Closed on
Nov 10, 2014
Sold by
Metzger Mary L
Bought by
Hibler Christopher J and Hibler Tracie A
Home Financials for this Owner
Home Financials are based on the most recent Mortgage that was taken out on this home.
Original Mortgage
$242,250
Interest Rate
4.21%
Mortgage Type
New Conventional
Purchase Details
Closed on
Nov 21, 2013
Sold by
Metzger Linda M
Bought by
Metzger Mary L
Create a Home Valuation Report for This Property
The Home Valuation Report is an in-depth analysis detailing your home's value as well as a comparison with similar homes in the area
Home Values in the Area
Average Home Value in this Area
Purchase History
| Date | Buyer | Sale Price | Title Company |
|---|---|---|---|
| Schmitt Doreen L | $290,000 | None Available | |
| Hibler Christopher John | -- | None Available | |
| Hibler Christopher J | $255,000 | None Available | |
| Metzger Mary L | -- | None Available |
Source: Public Records
Mortgage History
| Date | Status | Borrower | Loan Amount |
|---|---|---|---|
| Previous Owner | Hibler Christopher John | $237,847 | |
| Previous Owner | Hibler Christopher J | $242,250 |
Source: Public Records
Tax History Compared to Growth
Tax History
| Year | Tax Paid | Tax Assessment Tax Assessment Total Assessment is a certain percentage of the fair market value that is determined by local assessors to be the total taxable value of land and additions on the property. | Land | Improvement |
|---|---|---|---|---|
| 2024 | $4,266 | $321,200 | $66,000 | $255,200 |
| 2023 | $3,965 | $321,200 | $66,000 | $255,200 |
| 2022 | $4,139 | $321,200 | $66,000 | $255,200 |
| 2021 | $3,955 | $321,200 | $66,000 | $255,200 |
| 2020 | $4,053 | $256,800 | $60,500 | $196,300 |
| 2019 | $4,082 | $256,800 | $60,500 | $196,300 |
| 2018 | $3,826 | $241,700 | $60,500 | $181,200 |
| 2017 | $3,890 | $241,700 | $60,500 | $181,200 |
| 2016 | $3,659 | $241,700 | $60,500 | $181,200 |
| 2015 | $3,598 | $241,700 | $60,500 | $181,200 |
| 2014 | $3,585 | $241,700 | $60,500 | $181,200 |
| 2013 | $3,585 | $241,700 | $60,500 | $181,200 |
Source: Public Records
Map
Nearby Homes
- N76W24944 Ridgefield Dr
- W243N7650 Hilltop Ct
- N66W25720 Big Sky Dr
- W247N7543 Overland Rd
- N71W24818 Wildwood Way
- N70W25842 Coventry Ct
- N67W25396 Vail Ln
- N67W25606 Vail Ln
- W238N7214 Michele Ln
- N67W25502 Vail Ln
- N66W25683 Big Sky Dr
- N82W23452 Five Iron Way
- W279N6010 Serenity Dr
- N66W25688 Big Sky Dr
- N66W25696 Big Sky Dr
- Lt151 Big Sky Dr
- Lt25 Five Iron Way
- Lt150 Big Sky Dr
- Lt146 Big Sky Dr
- W253N6628 Heavenly Ct
- N79W25039 Hickory View Ln
- N79W25111 Hickory View Ln
- N79W25066 Hickory View Ln
- N79W25042 Hickory View Ln
- N79W25015 Hickory View Ln
- N79W25112 Hickory View Ln
- N79W25018 Hickory View Ln
- W249N7934 Hillside Rd
- W249N7958 Hillside Rd
- N79W24975 Plainview Rd
- W249N7876 Hillside Rd
- W249N7914 Hillside Rd
- Lot 2 Plainview Rd
- Lt3 Plainview Rd
- Lt4 Plainview Rd Unit Lt4
- N79W24949 Plainview Rd
- W249N7844 Hillside Rd
- N80W24956 Plainview Rd
- W249N7820 Hillside Rd
- N79W24901 Plainview Rd