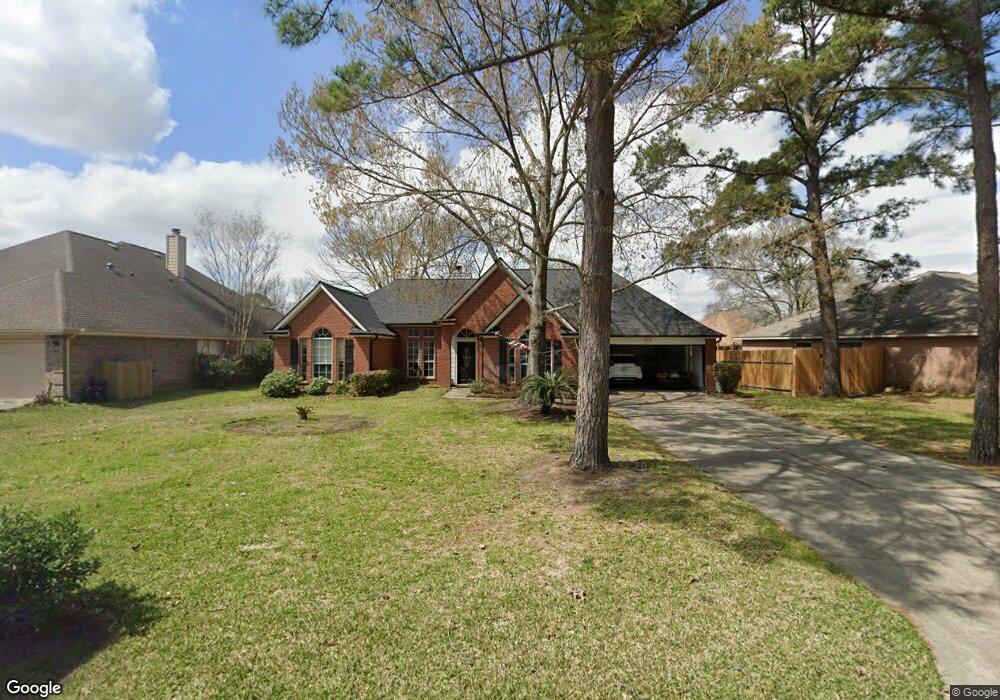
3507 Windhill Ln Montgomery, TX 77356
Lake Conroe NeighborhoodEstimated Value: $300,666 - $334,000
3
Beds
2
Baths
1,969
Sq Ft
$162/Sq Ft
Est. Value
About This Home
This home is located at 3507 Windhill Ln, Montgomery, TX 77356 and is currently estimated at $318,167, approximately $161 per square foot. 3507 Windhill Ln is a home located in Montgomery County with nearby schools including Madeley Ranch Elementary School, Montgomery Junior High School, and Montgomery High School.
Ownership History
Date
Name
Owned For
Owner Type
Purchase Details
Closed on
Feb 27, 2015
Sold by
Allsup Sterling and Allsup Jerry
Bought by
Nauck Glenn
Current Estimated Value
Purchase Details
Closed on
Feb 26, 2015
Sold by
Allsup Sterling and Allsup Jerry
Bought by
Nauck Glenn
Purchase Details
Closed on
Jun 7, 2012
Sold by
Hilburn Ervin and Hilburn Sara
Bought by
Allsup Sterling and Allsup Jerry
Home Financials for this Owner
Home Financials are based on the most recent Mortgage that was taken out on this home.
Original Mortgage
$110,062
Interest Rate
3.9%
Mortgage Type
New Conventional
Purchase Details
Closed on
Jun 30, 1997
Sold by
Norbert C Gloyna Builder Inc
Bought by
Hilburn Ervin and Hilburn Sarah
Home Financials for this Owner
Home Financials are based on the most recent Mortgage that was taken out on this home.
Original Mortgage
$113,900
Interest Rate
7.92%
Create a Home Valuation Report for This Property
The Home Valuation Report is an in-depth analysis detailing your home's value as well as a comparison with similar homes in the area
Home Values in the Area
Average Home Value in this Area
Purchase History
| Date | Buyer | Sale Price | Title Company |
|---|---|---|---|
| Nauck Glenn | -- | -- | |
| Nauck Glenn | -- | Capital Title | |
| Allsup Sterling | -- | Old Republic Title | |
| Hilburn Ervin | -- | -- |
Source: Public Records
Mortgage History
| Date | Status | Borrower | Loan Amount |
|---|---|---|---|
| Previous Owner | Allsup Sterling | $110,062 | |
| Previous Owner | Hilburn Ervin | $113,900 |
Source: Public Records
Tax History Compared to Growth
Tax History
| Year | Tax Paid | Tax Assessment Tax Assessment Total Assessment is a certain percentage of the fair market value that is determined by local assessors to be the total taxable value of land and additions on the property. | Land | Improvement |
|---|---|---|---|---|
| 2025 | $2,366 | $296,125 | $72,520 | $223,605 |
| 2024 | $2,282 | $280,599 | -- | -- |
| 2023 | $2,282 | $255,090 | $52,580 | $244,970 |
| 2022 | $4,784 | $231,900 | $52,580 | $223,410 |
| 2021 | $4,510 | $210,820 | $36,260 | $174,560 |
| 2020 | $4,532 | $204,700 | $36,260 | $168,440 |
| 2019 | $4,567 | $198,880 | $36,260 | $162,620 |
| 2018 | $4,070 | $177,210 | $5,890 | $171,320 |
| 2017 | $4,112 | $181,020 | $5,890 | $175,130 |
| 2016 | $4,112 | $181,020 | $5,890 | $175,130 |
| 2015 | $3,480 | $169,590 | $5,890 | $163,700 |
| 2014 | $3,480 | $154,370 | $5,890 | $148,480 |
Source: Public Records
Map
Nearby Homes
- 3603 Hickory Hill Ln
- 12206 Fairhaven Ln
- 12123 Walden Rd
- 12311 Hawthorne Dr
- 12014 Rainforest Ln
- 12122 Hawthorne Dr
- 12323 Thoreau Dr
- 3323 Rollingwood
- 3715 O Henry Dr
- 3503 Woodland Ln
- 12207 Glenview Dr
- 3802 Knollcrest Dr
- 12310 Glenview Dr
- 12003 Walden Rd
- 12226 Glenview Dr
- 3823 Knollcrest Dr
- 12455 Melville Dr Unit 3
- 12455 Melville Dr
- 12455 Melville Dr Unit 1
- 12455 Melville Dr Unit 7
- 3503 Windhill Ln
- 3511 Windhill Ln
- 12210 Thoreau Dr
- 3603 Windhill Ln
- 3506 Windhill Ln
- 12203 Fairhaven Ln
- 3502 Windhill Ln
- 12214 Thoreau Dr
- 3510 Windhill Ln
- 3607 Windhill Ln
- 3514 Windhill Ln
- 12207 Fairhaven Ln
- 12203 Thoreau Dr
- 12207 Thoreau Dr
- 3602 Windhill Ln
- 12127 N Thoreau Drive Rd N
- 12211 Thoreau Dr
- 12218 Thoreau Dr
- 12127 Thoreau Dr
- 3611 Windhill Ln