
Seller's Agent in 2023
Snooky Hill
Hopper Properties
(601) 906-1913
34 Total Sales
Estimated Value: $43,000
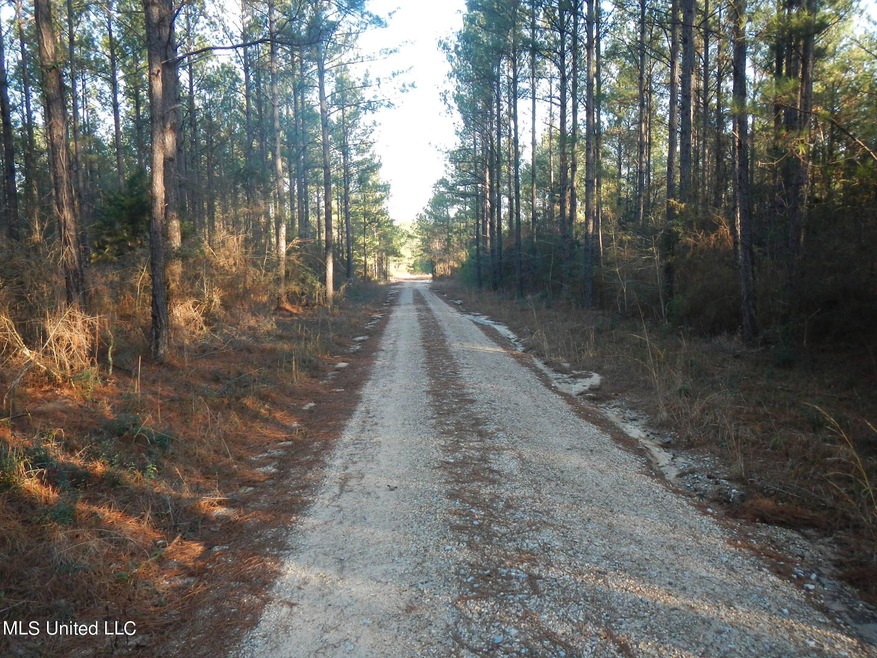
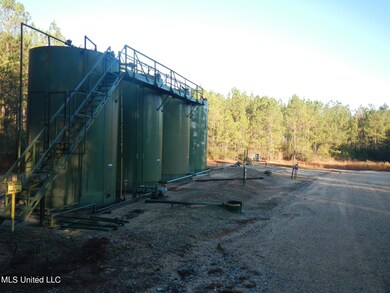
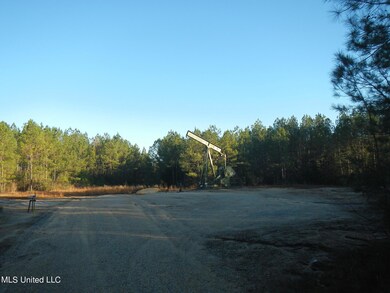
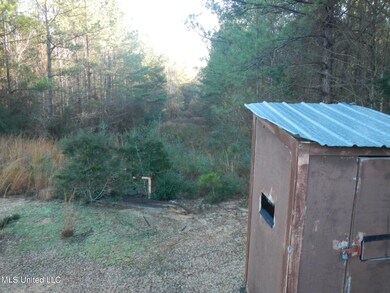
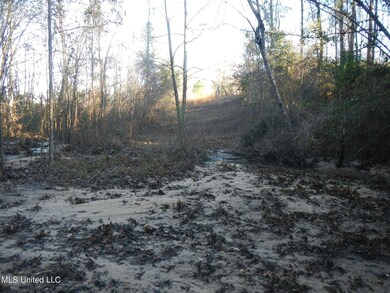
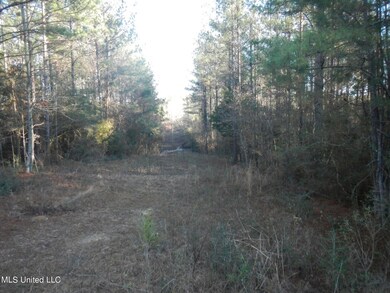
Located 20 minutes east of Laurel, this beautiful 77 acre tract is covered with planted pine, approx 25 years old, many trails, creeks and places to hunt. The seller has surface rights only.
| Date | Event | Price | List to Sale | Price per Sq Ft |
|---|---|---|---|---|
| 02/24/2023 02/24/23 | Sold | -- | -- | -- |
| 01/23/2023 01/23/23 | Pending | -- | -- | -- |
| 01/21/2023 01/21/23 | For Sale | $196,350 | -- | -- |
| Year | Tax Paid | Tax Assessment Tax Assessment Total Assessment is a certain percentage of the fair market value that is determined by local assessors to be the total taxable value of land and additions on the property. | Land | Improvement |
|---|---|---|---|---|
| 2025 | $433 | $4,070 | $0 | $0 |
| 2024 | $433 | $3,978 | $0 | $0 |
| 2023 | $433 | $4,436 | $0 | $0 |
| 2022 | $493 | $4,604 | $0 | $0 |
| 2021 | $483 | $4,787 | $0 | $0 |
| 2020 | $502 | $4,980 | $0 | $0 |
| 2019 | $488 | $5,195 | $0 | $0 |
| 2018 | $510 | $5,393 | $0 | $0 |
| 2017 | $481 | $5,186 | $0 | $0 |
| 2016 | $428 | $4,763 | $0 | $0 |
| 2015 | -- | $4,332 | $0 | $0 |
| 2014 | -- | $3,950 | $0 | $0 |
Seller's Agent in 2023
Snooky Hill
Hopper Properties
(601) 906-1913
34 Total Sales
Source: MLS United
MLS Number: 4037698
APN: 185-13-00001300
Disclaimer: Certain information contained herein is derived from information provided by parties other than Homes.com. All information provided is deemed reliable, but is not guaranteed to be accurate and should be independently verified.
![]() Information is deemed to be reliable but not guaranteed. Copyright 2026 MLS United, LLC.
Information is deemed to be reliable but not guaranteed. Copyright 2026 MLS United, LLC.
Ask me questions while you tour the home.