
Seller's Agent in 2020
Pamela Forsberg
J.W. Reedy Realty
(630) 234-4185
105 Total Sales
Estimated Value: $380,890 - $428,000
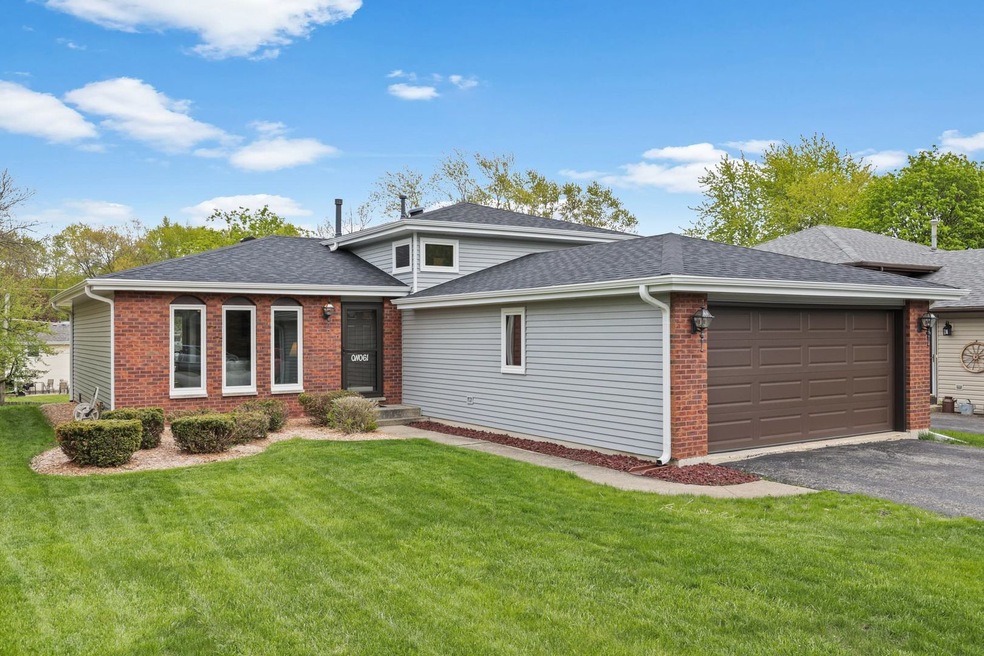
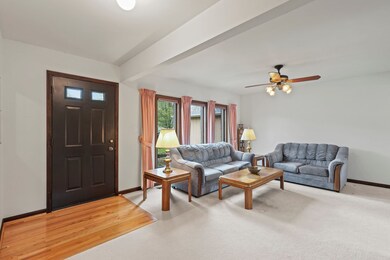
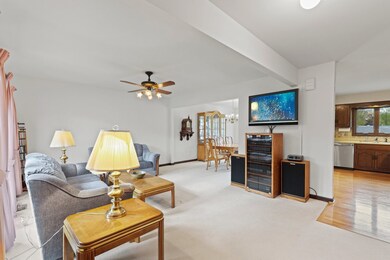
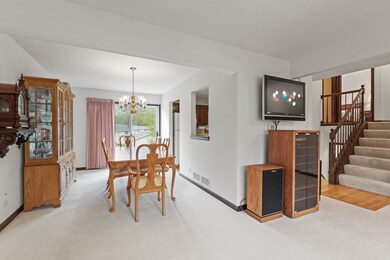
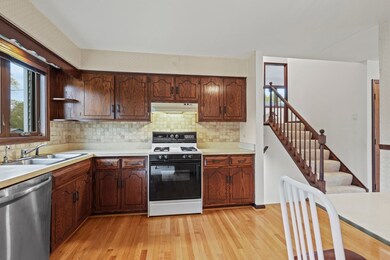
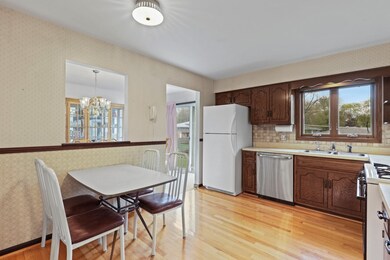
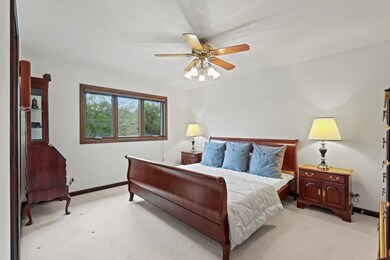
A great place to call home! Sharp 3 bedroom/2 bath split level architecture home includes a big master bedroom, shared en-suite bathroom and walk-in closet. Newer Roof, HVAC, Siding, Gutters, Soffits and Windows. Award-winning Wheaton Schools. Deep two-car garage. Great fenced yard. Plenty of storage too!
Last Agent to Sell the Property
J.W. Reedy Realty License #475176550 Listed on: 05/13/2020
We collect this data history from publicly available records. To have your information removed, we recommend requesting removal directly through your county’s website.
We collect this data history from publicly available records. To have your information removed, we recommend requesting removal directly through your county’s website.
| Date | Buyer | Sale Price | Title Company |
|---|---|---|---|
| $257,000 | Git |
We collect this data history from publicly available records. To have your information removed, we recommend requesting removal directly through your county’s website.
| Date | Status | Borrower | Loan Amount |
|---|---|---|---|
| Open | $231,300 |
We collect this data history from publicly available records. To have your information removed, we recommend requesting removal directly through your county’s website.
| Date | Event | Price | List to Sale | Price per Sq Ft |
|---|---|---|---|---|
| 06/18/2020 06/18/20 | Sold | $257,000 | +7.1% | $217 / Sq Ft |
| 05/18/2020 05/18/20 | Pending | -- | -- | -- |
| 05/13/2020 05/13/20 | For Sale | $239,900 | -- | $203 / Sq Ft |
We collect this data history from publicly available records. To have your information removed, we recommend requesting removal directly through your county’s website.
| Year | Tax Paid | Tax Assessment Tax Assessment Total Assessment is a certain percentage of the fair market value that is determined by local assessors to be the total taxable value of land and additions on the property. | Land | Improvement |
|---|---|---|---|---|
| 2024 | $5,826 | $101,002 | $17,230 | $83,772 |
| 2023 | $5,562 | $92,970 | $15,860 | $77,110 |
| 2022 | $5,458 | $87,870 | $14,990 | $72,880 |
| 2021 | $5,270 | $85,780 | $14,630 | $71,150 |
| 2020 | $5,242 | $84,980 | $14,490 | $70,490 |
| 2019 | $5,105 | $82,740 | $14,110 | $68,630 |
| 2018 | $4,759 | $76,880 | $13,300 | $63,580 |
| 2017 | $4,675 | $74,040 | $12,810 | $61,230 |
| 2016 | $4,604 | $71,080 | $12,300 | $58,780 |
| 2015 | $4,563 | $67,810 | $11,730 | $56,080 |
| 2014 | $5,195 | $75,100 | $10,650 | $64,450 |
| 2013 | $5,036 | $75,320 | $10,680 | $64,640 |
Seller's Agent in 2020
Pamela Forsberg
J.W. Reedy Realty
(630) 234-4185
105 Total Sales
A
Buyer's Agent in 2020
Albert Sung Voom
Partners 4U Realty Inc
(847) 274-1357
5 in this area
58 Total Sales
Source: Midwest Real Estate Data (MRED)
MLS Number: MRD10714353
APN: 05-07-421-034
Disclaimer: Certain information contained herein is derived from information provided by parties other than Homes.com. All information provided is deemed reliable, but is not guaranteed to be accurate and should be independently verified.
![]() All data is obtained from various sources and may not have been verified by broker or MLS GRID. Supplied Open House Information is subject to change without notice. All information should be independently reviewed and verified for accuracy. Properties may or may not be listed by the office/agent presenting the information. Some IDX listings have been excluded from this website.
All data is obtained from various sources and may not have been verified by broker or MLS GRID. Supplied Open House Information is subject to change without notice. All information should be independently reviewed and verified for accuracy. Properties may or may not be listed by the office/agent presenting the information. Some IDX listings have been excluded from this website.
Listings courtesy of Midwest Real Estate Data (MRED) as distributed by MLS GRID.
Based on information submitted to the MLS GRID
Ask me questions while you tour the home.