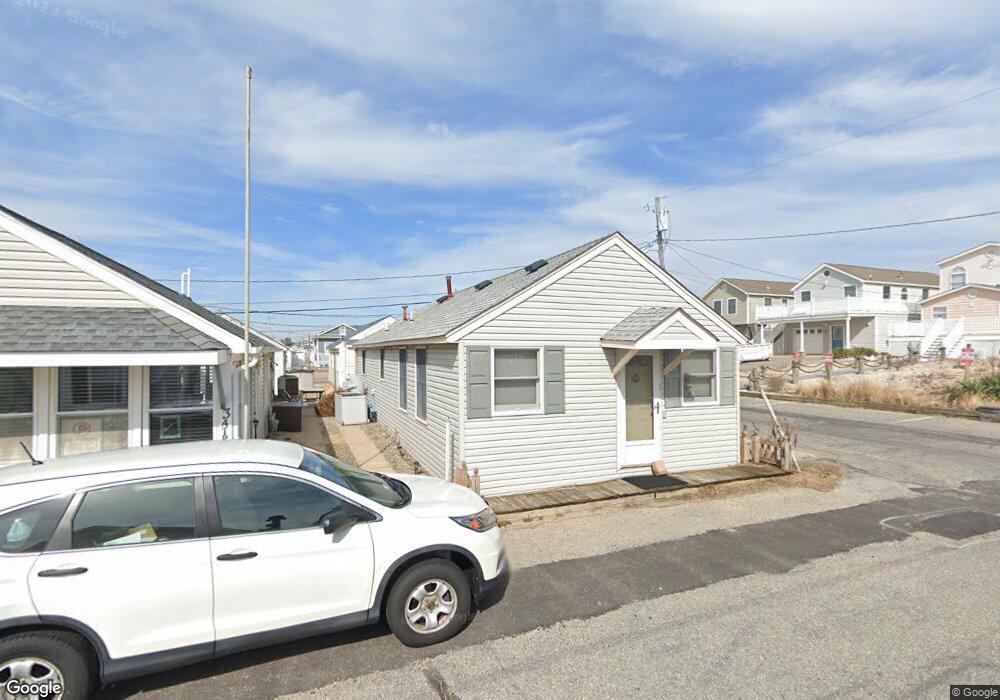
1 8th Ln Seaside Park, NJ 08752
Estimated Value: $627,000 - $682,000
3
Beds
1
Bath
792
Sq Ft
$820/Sq Ft
Est. Value
About This Home
This home is located at 1 8th Ln, Seaside Park, NJ 08752 and is currently estimated at $649,448, approximately $820 per square foot. 1 8th Ln is a home located in Ocean County with nearby schools including Central Regional Middle School and Central Regional High School.
Ownership History
Date
Name
Owned For
Owner Type
Purchase Details
Closed on
Sep 28, 2015
Sold by
Falzon James G and Falzon Carolyn G
Bought by
King Marlene
Current Estimated Value
Purchase Details
Closed on
May 30, 2003
Sold by
Egan Michael F
Bought by
Falzon James G and Falzon Carolyn G
Home Financials for this Owner
Home Financials are based on the most recent Mortgage that was taken out on this home.
Original Mortgage
$224,000
Interest Rate
5.46%
Create a Home Valuation Report for This Property
The Home Valuation Report is an in-depth analysis detailing your home's value as well as a comparison with similar homes in the area
Home Values in the Area
Average Home Value in this Area
Purchase History
| Date | Buyer | Sale Price | Title Company |
|---|---|---|---|
| King Marlene | $355,000 | Multiple | |
| Falzon James G | $280,000 | -- |
Source: Public Records
Mortgage History
| Date | Status | Borrower | Loan Amount |
|---|---|---|---|
| Previous Owner | Falzon James G | $224,000 |
Source: Public Records
Tax History
| Year | Tax Paid | Tax Assessment Tax Assessment Total Assessment is a certain percentage of the fair market value that is determined by local assessors to be the total taxable value of land and additions on the property. | Land | Improvement |
|---|---|---|---|---|
| 2025 | $9,195 | $355,000 | $300,000 | $55,000 |
| 2024 | $8,236 | $355,000 | $300,000 | $55,000 |
| 2023 | $8,083 | $355,000 | $300,000 | $55,000 |
| 2022 | $8,083 | $355,000 | $300,000 | $55,000 |
| 2021 | $7,913 | $355,000 | $300,000 | $55,000 |
| 2020 | $7,913 | $355,000 | $300,000 | $55,000 |
| 2019 | $7,693 | $355,000 | $300,000 | $55,000 |
| 2018 | $7,668 | $355,000 | $300,000 | $55,000 |
| 2017 | $7,588 | $364,800 | $300,000 | $64,800 |
| 2016 | $7,548 | $364,800 | $300,000 | $64,800 |
| 2015 | $7,340 | $364,800 | $300,000 | $64,800 |
| 2014 | $7,132 | $364,800 | $300,000 | $64,800 |
Source: Public Records
Map
Nearby Homes
Your Personal Tour Guide
Ask me questions while you tour the home.