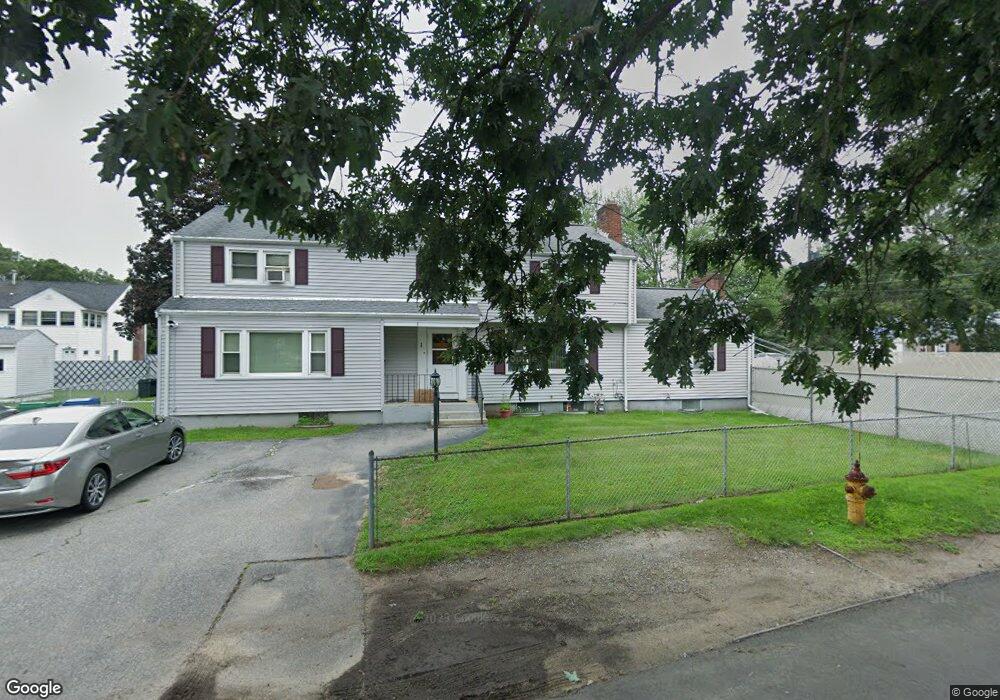
1 Algonquin Dr Burlington, MA 01803
Havenville NeighborhoodEstimated Value: $918,188 - $1,131,000
About This Home
This home is located at 1 Algonquin Dr, Burlington, MA 01803 and is currently estimated at $1,030,047, approximately $334 per square foot. 1 Algonquin Dr is a home located in Middlesex County with nearby schools including Burlington High School, Francis Wyman Elementary School, and Marshall Simonds Middle School.
Ownership History
We collect this data history from publicly available records. To have your information removed, we recommend requesting removal directly through your county’s website.
Purchase Details
Purchase Details
Home Financials for this Owner
Home Financials are based on the most recent Mortgage that was taken out on this home.Home Values in the Area
Average Home Value in this Area
Purchase History
We collect this data history from publicly available records. To have your information removed, we recommend requesting removal directly through your county’s website.
| Date | Buyer | Sale Price | Title Company |
|---|---|---|---|
| -- | -- | ||
| $485,500 | -- | ||
| $485,500 | -- |
Mortgage History
We collect this data history from publicly available records. To have your information removed, we recommend requesting removal directly through your county’s website.
| Date | Status | Borrower | Loan Amount |
|---|---|---|---|
| Previous Owner | $485,500 | ||
| Previous Owner | $66,000 | ||
| Previous Owner | $63,900 |
Tax History
We collect this data history from publicly available records. To have your information removed, we recommend requesting removal directly through your county’s website.
| Year | Tax Paid | Tax Assessment Tax Assessment Total Assessment is a certain percentage of the fair market value that is determined by local assessors to be the total taxable value of land and additions on the property. | Land | Improvement |
|---|---|---|---|---|
| 2025 | $6,563 | $757,800 | $361,100 | $396,700 |
| 2024 | $6,290 | $703,600 | $329,700 | $373,900 |
| 2023 | $6,125 | $651,600 | $285,700 | $365,900 |
| 2022 | $5,960 | $599,000 | $259,800 | $339,200 |
| 2021 | $4,358 | $588,500 | $243,300 | $345,200 |
| 2020 | $5,576 | $578,400 | $239,400 | $339,000 |
| 2019 | $5,442 | $519,300 | $223,700 | $295,600 |
| 2018 | $5,320 | $500,900 | $217,400 | $283,500 |
| 2017 | $5,206 | $500,900 | $217,400 | $283,500 |
| 2016 | $5,178 | $451,800 | $188,400 | $263,400 |
| 2015 | $5,128 | $451,800 | $188,400 | $263,400 |
| 2014 | $4,858 | $404,800 | $168,000 | $236,800 |
Map
- 18 Druid Hill Ave
- 34 Washington Ave
- 31 Mohawk Rd
- 12 Chadwick Rd
- 22 Marrett Rd
- 5 Hallmark Gardens Unit 12
- 12 Hallmark Gardens Unit 7
- 29 Bedford St
- 48 Purity Springs Rd
- 15 Pleasant St
- 33 Daniel Dr
- 61 Lexington St
- 23 Gloria Cir
- 5 Williams Cir
- 9 Fernglade Rd
- 8 Shady Lane Dr
- 10 Hillcrest Rd
- 235 Cambridge St Unit 202
- 1 Highland Way
- 6 Arthur Woods Ave
Ask me questions while you tour the home.