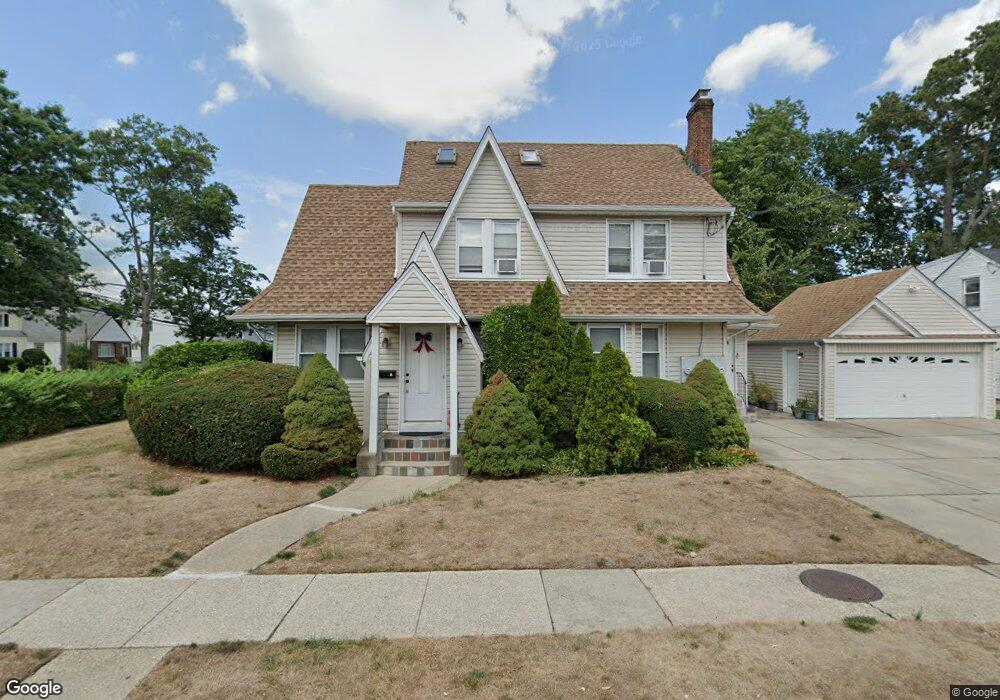
1 Allen St Lynbrook, NY 11563
Estimated Value: $819,937 - $908,000
3
Beds
2
Baths
2,117
Sq Ft
$408/Sq Ft
Est. Value
About This Home
This home is located at 1 Allen St, Lynbrook, NY 11563 and is currently estimated at $863,969, approximately $408 per square foot. 1 Allen St is a home located in Nassau County with nearby schools including Davison Avenue Intermediate School, Maurice W. Downing Primary K-2 School, and Howard T Herber Middle School.
Ownership History
Date
Name
Owned For
Owner Type
Purchase Details
Closed on
Feb 5, 2015
Sold by
1 Allen Street Holding Llc
Bought by
Asutra Corp
Current Estimated Value
Purchase Details
Closed on
Aug 18, 2011
Sold by
Abballe Sandro and Abballe Angelo
Bought by
1 Allen Street Holding Llc
Purchase Details
Closed on
Feb 11, 2011
Sold by
U S Bank National Association
Bought by
Abballe Sandro and Abballe Angelo
Purchase Details
Closed on
Aug 27, 2004
Sold by
Wilson Heulmo
Bought by
Greene Cornelius
Purchase Details
Closed on
Oct 30, 2001
Sold by
Wagner Katharina M
Bought by
Huelmo Gladys and Huelmo Wilson
Create a Home Valuation Report for This Property
The Home Valuation Report is an in-depth analysis detailing your home's value as well as a comparison with similar homes in the area
Home Values in the Area
Average Home Value in this Area
Purchase History
We collect this data history from publicly available records. To have your information removed, we recommend requesting removal directly through your county’s website.
| Date | Buyer | Sale Price | Title Company |
|---|---|---|---|
| Asutra Corp | $295,000 | The Judicial Title Insurance | |
| 1 Allen Street Holding Llc | -- | -- | |
| Abballe Sandro | $260,000 | -- | |
| Greene Cornelius | $490,000 | -- | |
| Huelmo Gladys | $245,000 | David M Glick |
Source: Public Records
Tax History
| Year | Tax Paid | Tax Assessment Tax Assessment Total Assessment is a certain percentage of the fair market value that is determined by local assessors to be the total taxable value of land and additions on the property. | Land | Improvement |
|---|---|---|---|---|
| 2025 | $12,218 | $561 | $184 | $377 |
| 2024 | $1,164 | $544 | $179 | $365 |
| 2023 | $11,026 | $563 | $185 | $378 |
| 2022 | $11,026 | $563 | $185 | $378 |
| 2021 | $15,447 | $556 | $183 | $373 |
| 2020 | $9,989 | $644 | $455 | $189 |
| 2019 | $9,599 | $690 | $419 | $271 |
| 2018 | $9,613 | $736 | $0 | $0 |
| 2017 | $8,961 | $802 | $412 | $390 |
| 2016 | $10,121 | $948 | $487 | $461 |
| 2015 | $1,408 | $948 | $434 | $514 |
| 2014 | $1,408 | $948 | $434 | $514 |
| 2013 | $1,291 | $948 | $487 | $461 |
Source: Public Records
Map
Nearby Homes
- 63 Buckingham Place
- 54 Rolling St
- 76 Driving Park Ave
- 58 Chestnut St
- 7 Bristol St
- 45 Lynbrook Ave
- 124 Lakeview Ave
- 138 Chestnut St
- 135 Chestnut St
- 1357 Langdon Blvd
- 18 Watkins St
- 437 Yale Ave
- 266 Earle Ave
- 43 Nassau Blvd
- 10 Aberdeen St
- 20 Nassau Blvd
- 108 Hempstead Ave
- 49 Malden Ave
- 175 Hempstead Ave
- 157 Hempstead Ave Unit B20
Your Personal Tour Guide
Ask me questions while you tour the home.