1 Bates St Danvers, MA 01923
Estimated Value: $667,000 - $723,000
About This Home
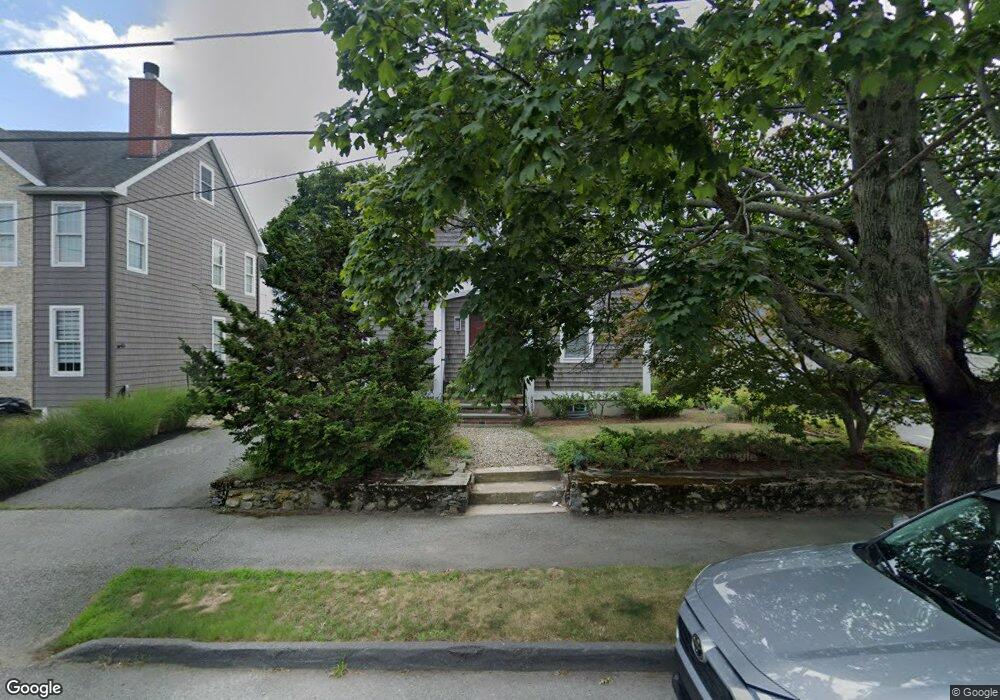
This home is located at 1 Bates St, Danvers, MA 01923 and is currently estimated at $689,810, approximately $656 per square foot. 1 Bates St is a home located in Essex County with nearby schools including Danvers High School, St John The Baptist School, and Bishop Fenwick High School.
Ownership History
We collect this data history from publicly available records. To have your information removed, we recommend requesting removal directly through your county’s website.
Purchase Details
Purchase Details
Home Values in the Area
Average Home Value in this Area
Purchase History
We collect this data history from publicly available records. To have your information removed, we recommend requesting removal directly through your county’s website.
| Date | Buyer | Sale Price | Title Company |
|---|---|---|---|
| -- | -- | ||
| $125,000 | -- |
Mortgage History
We collect this data history from publicly available records. To have your information removed, we recommend requesting removal directly through your county’s website.
| Date | Status | Borrower | Loan Amount |
|---|---|---|---|
| Previous Owner | $191,600 | ||
| Previous Owner | $193,100 |
Tax History
We collect this data history from publicly available records. To have your information removed, we recommend requesting removal directly through your county’s website.
| Year | Tax Paid | Tax Assessment Tax Assessment Total Assessment is a certain percentage of the fair market value that is determined by local assessors to be the total taxable value of land and additions on the property. | Land | Improvement |
|---|---|---|---|---|
| 2025 | $6,503 | $591,700 | $327,300 | $264,400 |
| 2024 | $6,364 | $572,800 | $316,100 | $256,700 |
| 2023 | $6,109 | $519,900 | $285,600 | $234,300 |
| 2022 | $5,983 | $472,600 | $259,600 | $213,000 |
| 2021 | $5,779 | $432,900 | $247,200 | $185,700 |
| 2020 | $5,654 | $432,900 | $247,200 | $185,700 |
| 2019 | $5,273 | $397,100 | $214,500 | $182,600 |
| 2018 | $5,194 | $383,600 | $214,500 | $169,100 |
| 2017 | $5,039 | $355,100 | $195,300 | $159,800 |
| 2016 | $4,848 | $341,400 | $186,200 | $155,200 |
| 2015 | $4,731 | $317,300 | $163,700 | $153,600 |
Map
- 90 Water St
- 152 Water St Unit 13
- 173 Water St
- 2 Mcdewell Ave Unit 12
- 58 River St Unit 3
- 35 Doty Ave
- 43 Needham Rd Unit 2
- 24 Shortell Ave
- 166 High St
- 162 High St Unit B
- 7 E Garfield Ave
- 18 Hardy St
- 6 Jersey Ln
- 9 Parkview Ave
- 95 Abington Rd Unit 95
- 8 Sparrow Ln
- 45 Abington Rd Unit 45
- 62 Purchase St Unit C3
- 37 Hillcrest Ave
- 15 Carol Ann Rd
Ask me questions while you tour the home.