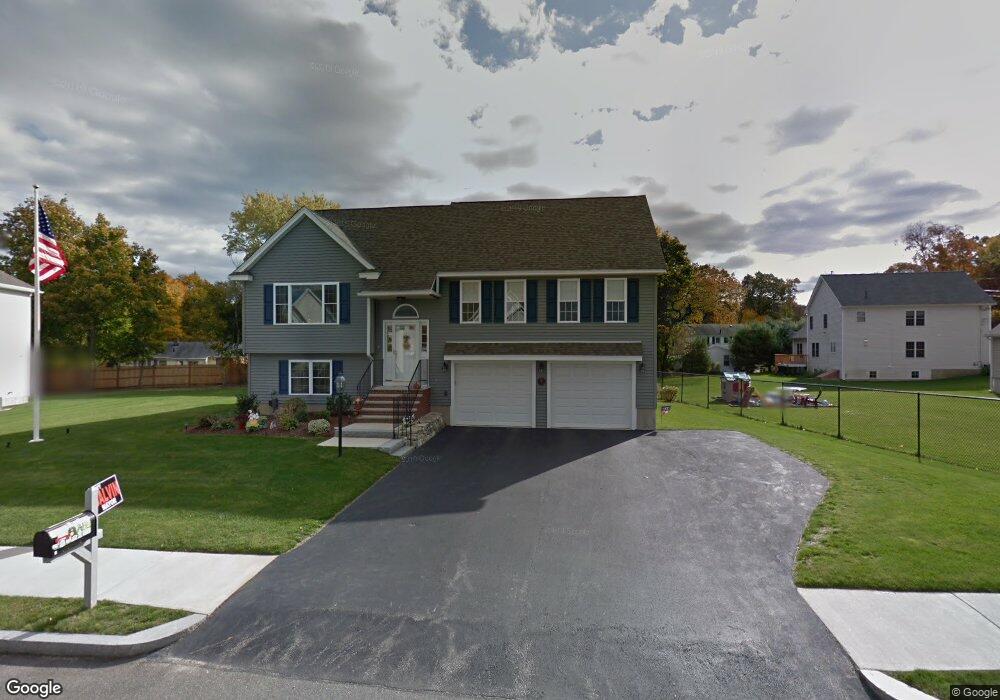
1 Callahan Dr Woburn, MA 01801
Mishawum NeighborhoodEstimated Value: $879,000 - $1,090,189
About This Home
This home is located at 1 Callahan Dr, Woburn, MA 01801 and is currently estimated at $981,797, approximately $478 per square foot. 1 Callahan Dr is a home located in Middlesex County with nearby schools including Linscott-Rumford Elementary School, John F. Kennedy Middle School, and Woburn High School.
Ownership History
We collect this data history from publicly available records. To have your information removed, we recommend requesting removal directly through your county’s website.
Purchase Details
Purchase Details
Purchase Details
Home Values in the Area
Average Home Value in this Area
Purchase History
We collect this data history from publicly available records. To have your information removed, we recommend requesting removal directly through your county’s website.
| Date | Buyer | Sale Price | Title Company |
|---|---|---|---|
| -- | -- | ||
| -- | -- | ||
| -- | -- | ||
| -- | -- | ||
| $449,900 | -- | ||
| $449,900 | -- |
Tax History
We collect this data history from publicly available records. To have your information removed, we recommend requesting removal directly through your county’s website.
| Year | Tax Paid | Tax Assessment Tax Assessment Total Assessment is a certain percentage of the fair market value that is determined by local assessors to be the total taxable value of land and additions on the property. | Land | Improvement |
|---|---|---|---|---|
| 2025 | $8,494 | $994,600 | $385,000 | $609,600 |
| 2024 | $7,869 | $976,300 | $366,700 | $609,600 |
| 2023 | $7,604 | $874,000 | $333,400 | $540,600 |
| 2022 | $7,371 | $789,200 | $290,000 | $499,200 |
| 2021 | $7,100 | $761,000 | $276,200 | $484,800 |
| 2020 | $6,807 | $730,400 | $276,200 | $454,200 |
| 2019 | $6,458 | $679,800 | $263,100 | $416,700 |
| 2018 | $6,241 | $631,000 | $241,400 | $389,600 |
| 2017 | $6,017 | $605,300 | $229,900 | $375,400 |
| 2016 | $5,799 | $577,000 | $214,900 | $362,100 |
| 2015 | $5,608 | $551,400 | $200,800 | $350,600 |
| 2014 | $4,457 | $426,900 | $200,800 | $226,100 |
Map
- 6 Cooley Dr Unit 6
- 12 Karen Rd
- 159 Mishawum Rd
- 15 Cronin Way
- 17 Cronin Way
- 106 Mishawum Rd
- 8 Alfred Place
- 6 Fairview Terrace
- 7 Intervale St
- 0 Fryeburg Rd
- 49 Eaton Ave
- 50 Mishawum Rd
- 6 Tidd Ave
- 83 Merrimac St
- 37 Maple Ave
- 2 Dobbins Dr
- 23 Ward St
- 23 Ward St Unit A
- 74 Beach St Unit 6-8
- 166 Place Ln Unit 166
Ask me questions while you tour the home.