1 Charles St Unit U Reading, MA 01867
Estimated Value: $563,000 - $677,000
3
Beds
2
Baths
1,826
Sq Ft
$337/Sq Ft
Est. Value
About This Home
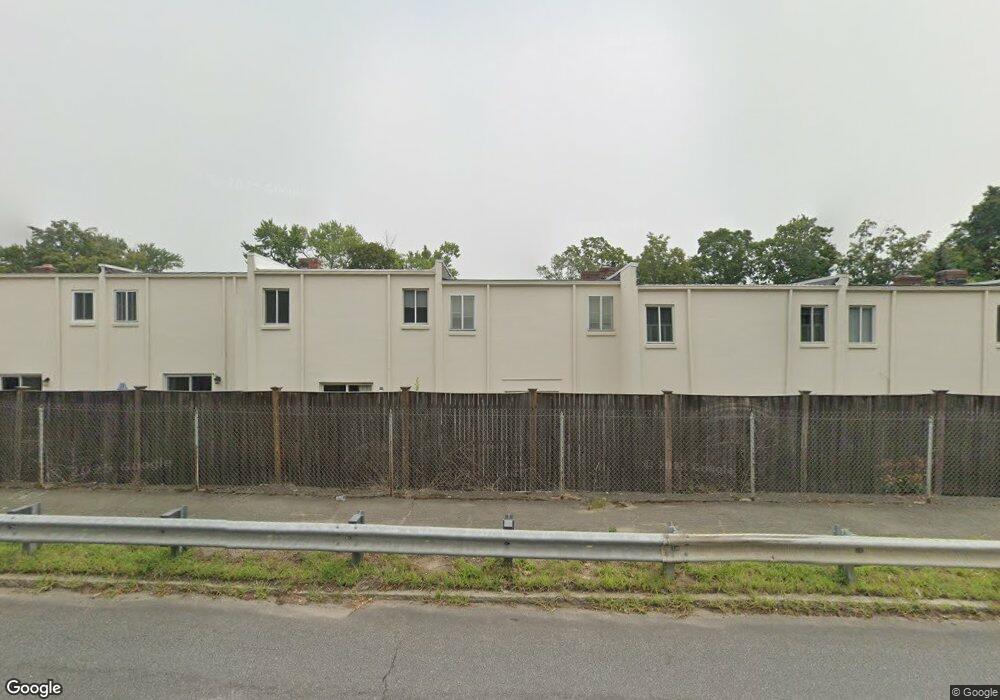
This home is located at 1 Charles St Unit U, Reading, MA 01867 and is currently estimated at $615,141, approximately $336 per square foot. 1 Charles St Unit U is a home located in Middlesex County with nearby schools including J. Warren Killam Elementary School, Walter S. Parker Middle School, and Reading Memorial High School.
Ownership History
Date
Name
Owned For
Owner Type
Purchase Details
Closed on
Aug 7, 2009
Sold by
Tyrie Robin R
Bought by
Dearborn Mary M
Current Estimated Value
Home Financials for this Owner
Home Financials are based on the most recent Mortgage that was taken out on this home.
Original Mortgage
$244,200
Outstanding Balance
$158,055
Interest Rate
5.47%
Mortgage Type
Purchase Money Mortgage
Estimated Equity
$457,086
Purchase Details
Closed on
Mar 1, 2002
Sold by
Gregorio John A
Bought by
Tyrie Robin R
Home Financials for this Owner
Home Financials are based on the most recent Mortgage that was taken out on this home.
Original Mortgage
$211,900
Interest Rate
6.85%
Mortgage Type
Purchase Money Mortgage
Purchase Details
Closed on
Jan 3, 2002
Sold by
Stavaridis Anne T
Bought by
Gregorio John A
Home Financials for this Owner
Home Financials are based on the most recent Mortgage that was taken out on this home.
Original Mortgage
$211,900
Interest Rate
6.85%
Mortgage Type
Purchase Money Mortgage
Purchase Details
Closed on
Oct 24, 1996
Sold by
Kelleher Patricia A
Bought by
Stavaridis Anne T
Purchase Details
Closed on
May 31, 1994
Sold by
Logan Christopher W and Logan Heidi F
Bought by
Kelleher Patricia A
Create a Home Valuation Report for This Property
The Home Valuation Report is an in-depth analysis detailing your home's value as well as a comparison with similar homes in the area
Home Values in the Area
Average Home Value in this Area
Purchase History
We collect this data history from publicly available records. To have your information removed, we recommend requesting removal directly through your county’s website.
| Date | Buyer | Sale Price | Title Company |
|---|---|---|---|
| Dearborn Mary M | $274,900 | -- | |
| Tyrie Robin R | $264,900 | -- | |
| Gregorio John A | $190,000 | -- | |
| Stavaridis Anne T | $130,000 | -- | |
| Kelleher Patricia A | $120,000 | -- |
Source: Public Records
Mortgage History
We collect this data history from publicly available records. To have your information removed, we recommend requesting removal directly through your county’s website.
| Date | Status | Borrower | Loan Amount |
|---|---|---|---|
| Open | Dearborn Mary M | $244,200 | |
| Previous Owner | Kelleher Patricia A | $211,900 |
Source: Public Records
Tax History
| Year | Tax Paid | Tax Assessment Tax Assessment Total Assessment is a certain percentage of the fair market value that is determined by local assessors to be the total taxable value of land and additions on the property. | Land | Improvement |
|---|---|---|---|---|
| 2025 | $6,059 | $532,000 | $0 | $532,000 |
| 2024 | $5,971 | $509,500 | $0 | $509,500 |
| 2023 | $5,671 | $450,400 | $0 | $450,400 |
| 2022 | $4,691 | $351,900 | $0 | $351,900 |
| 2021 | $5,117 | $370,500 | $0 | $370,500 |
| 2020 | $5,061 | $362,800 | $0 | $362,800 |
| 2019 | $4,965 | $348,900 | $0 | $348,900 |
| 2018 | $4,624 | $333,400 | $0 | $333,400 |
| 2017 | $4,331 | $308,700 | $0 | $308,700 |
| 2016 | $4,102 | $282,900 | $0 | $282,900 |
| 2015 | $4,065 | $276,500 | $0 | $276,500 |
| 2014 | $3,958 | $268,500 | $0 | $268,500 |
Source: Public Records
Map
Nearby Homes
- 1 Charles St Unit X
- 52 Sanborn St Unit 7
- 856 Main St
- 863 Main St
- 11 Linden St
- 48 Village St Unit 1001
- 82 Orange St
- 44 Grandview Rd
- 28 Audubon Rd
- 41 Winter St
- 400 Main St
- 215 Pearl St
- 6 Ivy Ln
- 249 Salem St Unit 4
- 7 King St
- 295 Main St Unit 15
- 295 Main St Unit 16
- 44 Pitman Dr
- 168 Summer Ave
- 115 Prescott St
- 1 Charles St Unit Y
- 1 Charles St Unit X
- 1 Charles St Unit W
- 1 Charles St Unit V
- 1 Charles St Unit T
- 1 Charles St Unit S
- 1 Charles St Unit R
- 1 Charles St Unit Q
- 1 Charles St Unit P
- 1 Charles St Unit O
- 1 Charles St Unit N
- 1 Charles St Unit M
- 1 Charles St Unit L
- 1 Charles St Unit K
- 1 Charles St Unit J
- 1 Charles St Unit I
- 1 Charles St Unit H
- 1 Charles St Unit G
- 1 Charles St Unit F
- 1 Charles St Unit E
Your Personal Tour Guide
Ask me questions while you tour the home.