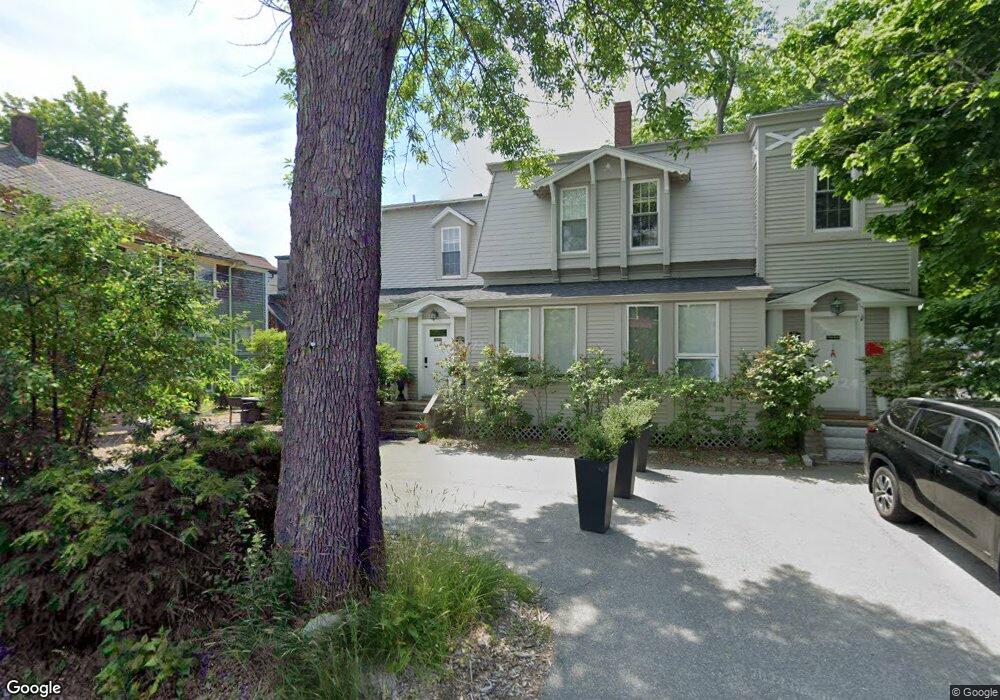
1 High St Bar Harbor, ME 04609
Estimated Value: $591,000 - $1,006,000
5
Beds
3
Baths
2,720
Sq Ft
$295/Sq Ft
Est. Value
About This Home
This home is located at 1 High St, Bar Harbor, ME 04609 and is currently estimated at $802,688, approximately $295 per square foot. 1 High St is a home located in Hancock County with nearby schools including Conners-Emerson School, Mt. Desert Island High School, and Acadia School.
Ownership History
Date
Name
Owned For
Owner Type
Purchase Details
Closed on
Nov 19, 2021
Sold by
Triple A & J Llc
Bought by
High Time Llc
Current Estimated Value
Home Financials for this Owner
Home Financials are based on the most recent Mortgage that was taken out on this home.
Original Mortgage
$400,000
Outstanding Balance
$366,071
Interest Rate
3.05%
Mortgage Type
Purchase Money Mortgage
Estimated Equity
$436,617
Purchase Details
Closed on
Jul 5, 2005
Sold by
Booher Dean E
Bought by
Moon Stephen H and Moon Roxanne B
Create a Home Valuation Report for This Property
The Home Valuation Report is an in-depth analysis detailing your home's value as well as a comparison with similar homes in the area
Home Values in the Area
Average Home Value in this Area
Purchase History
| Date | Buyer | Sale Price | Title Company |
|---|---|---|---|
| High Time Llc | -- | None Available | |
| Moon Stephen H | -- | -- |
Source: Public Records
Mortgage History
| Date | Status | Borrower | Loan Amount |
|---|---|---|---|
| Open | High Time Llc | $400,000 |
Source: Public Records
Tax History
| Year | Tax Paid | Tax Assessment Tax Assessment Total Assessment is a certain percentage of the fair market value that is determined by local assessors to be the total taxable value of land and additions on the property. | Land | Improvement |
|---|---|---|---|---|
| 2024 | $6,026 | $600,200 | $373,600 | $226,600 |
| 2023 | $5,210 | $600,200 | $373,600 | $226,600 |
| 2022 | $4,734 | $507,900 | $316,100 | $191,800 |
| 2021 | $4,443 | $456,200 | $287,400 | $168,800 |
| 2020 | $4,429 | $372,200 | $179,300 | $192,900 |
| 2019 | $4,367 | $368,500 | $177,500 | $191,000 |
| 2018 | $3,822 | $330,600 | $177,500 | $153,100 |
| 2017 | $3,623 | $330,600 | $177,500 | $153,100 |
| 2016 | $3,547 | $330,600 | $177,500 | $153,100 |
| 2015 | $3,501 | $330,600 | $177,500 | $153,100 |
| 2014 | $3,379 | $330,600 | $177,500 | $153,100 |
| 2012 | $3,253 | $330,600 | $177,500 | $153,100 |
Source: Public Records
Map
Nearby Homes
- Na 1
- 17 Bowles Ave
- 12 Bowles Ave
- 67 School St
- 3 Wayman Ln
- Lot 21 Hamilton Hill Way
- 18 Glen Mary Rd
- Lot 20 Hamilton Hill Way
- 41 Hamilton Hill Way
- 2 Mountain Ave
- 62 Sols Cliff Rd
- 18 Greenway Ct
- 3 Bogue Chitto Ln Unit 1
- 10 Bogue Chitto Ln
- # Maine 3
- 3 Applewood Ln Unit 3
- 7 Applewood Ln
- 10 Harbor Lights Rd
- 2 Lookout Point Rd
- 7 Harbor Lights Rd
Your Personal Tour Guide
Ask me questions while you tour the home.