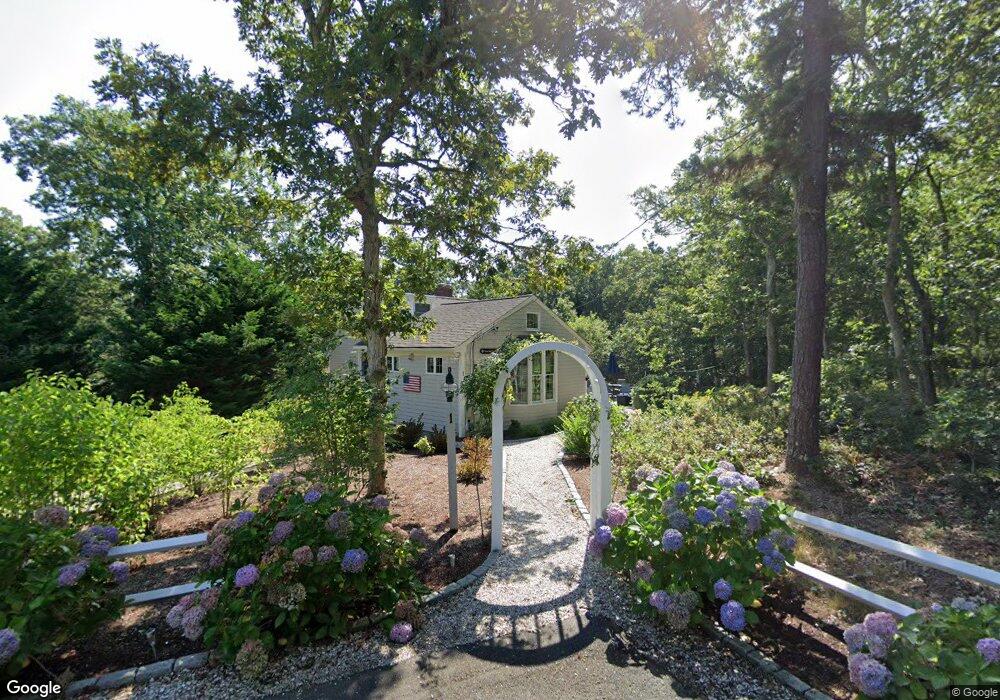
1 Lazy Ln Harwich, MA 02645
East Harwich NeighborhoodEstimated Value: $942,680 - $1,253,000
3
Beds
3
Baths
1,850
Sq Ft
$569/Sq Ft
Est. Value
About This Home
This home is located at 1 Lazy Ln, Harwich, MA 02645 and is currently estimated at $1,053,170, approximately $569 per square foot. 1 Lazy Ln is a home located in Barnstable County with nearby schools including Harwich Elementary School, Chatham Elementary School, and Monomoy Regional Middle School.
Ownership History
Date
Name
Owned For
Owner Type
Purchase Details
Closed on
Aug 4, 2023
Sold by
Pruskin Michelle and Pruskin Marc A
Bought by
Pruskin Rt and Pruskin
Current Estimated Value
Purchase Details
Closed on
Jan 27, 2005
Sold by
Kearns Charlotte and Kearns Thomas
Bought by
Pruskin Marc and Pruskin Michelle M
Home Financials for this Owner
Home Financials are based on the most recent Mortgage that was taken out on this home.
Original Mortgage
$275,500
Interest Rate
5.67%
Mortgage Type
Purchase Money Mortgage
Purchase Details
Closed on
Oct 22, 2001
Sold by
Wilkins Robin and Wilkins Joan A
Bought by
Kearns Thomas and Kearns Charlotte C
Home Financials for this Owner
Home Financials are based on the most recent Mortgage that was taken out on this home.
Original Mortgage
$242,200
Interest Rate
6.92%
Mortgage Type
Purchase Money Mortgage
Create a Home Valuation Report for This Property
The Home Valuation Report is an in-depth analysis detailing your home's value as well as a comparison with similar homes in the area
Home Values in the Area
Average Home Value in this Area
Purchase History
| Date | Buyer | Sale Price | Title Company |
|---|---|---|---|
| Pruskin Rt | -- | None Available | |
| Pruskin Marc | $575,500 | -- | |
| Pruskin Marc | $575,500 | -- | |
| Kearns Thomas | $323,000 | -- | |
| Kearns Thomas | $323,000 | -- |
Source: Public Records
Mortgage History
| Date | Status | Borrower | Loan Amount |
|---|---|---|---|
| Previous Owner | Pruskin Marc | $275,500 | |
| Previous Owner | Kearns Thomas | $242,200 |
Source: Public Records
Tax History
| Year | Tax Paid | Tax Assessment Tax Assessment Total Assessment is a certain percentage of the fair market value that is determined by local assessors to be the total taxable value of land and additions on the property. | Land | Improvement |
|---|---|---|---|---|
| 2025 | $5,480 | $927,300 | $229,500 | $697,800 |
| 2024 | $5,277 | $875,100 | $216,500 | $658,600 |
| 2023 | $4,967 | $748,000 | $196,800 | $551,200 |
| 2022 | $4,789 | $590,500 | $171,200 | $419,300 |
| 2021 | $4,825 | $561,100 | $169,200 | $391,900 |
| 2020 | $4,777 | $547,200 | $168,600 | $378,600 |
| 2019 | $4,488 | $517,700 | $159,900 | $357,800 |
| 2018 | $4,336 | $478,400 | $129,800 | $348,600 |
| 2017 | $4,063 | $453,000 | $118,300 | $334,700 |
| 2016 | $3,943 | $434,700 | $118,300 | $316,400 |
| 2015 | $3,953 | $440,700 | $129,900 | $310,800 |
| 2014 | $3,754 | $428,000 | $126,000 | $302,000 |
Source: Public Records
Map
Nearby Homes
- 4 Skipper Shea Ln
- 63 Idle Way
- 1157 Orleans-Harwich Rd
- 1025 Orleans-Harwich Rd
- 10 Middle Rd
- 16 Turtle Run
- 15 Quail Nest Run
- 23 Dundee Cir
- 26 Walkerwoods Dr
- 54 Marthas Ln
- 58 Marthas Ln
- L261 Queen Anne Rd
- 19 Walkerwoods Dr
- 47 Anchorage Ct
- 252 Chatham Rd
- 25 Robert Rd
- 0 Tirrells Way
- 58 Tirrells Way
- 13 Harwich Pines
- 7 Howard Rd
Your Personal Tour Guide
Ask me questions while you tour the home.