1 Marco Ct Fall River, MA 02720
Highlands-Fall River NeighborhoodEstimated Value: $426,000 - $501,000
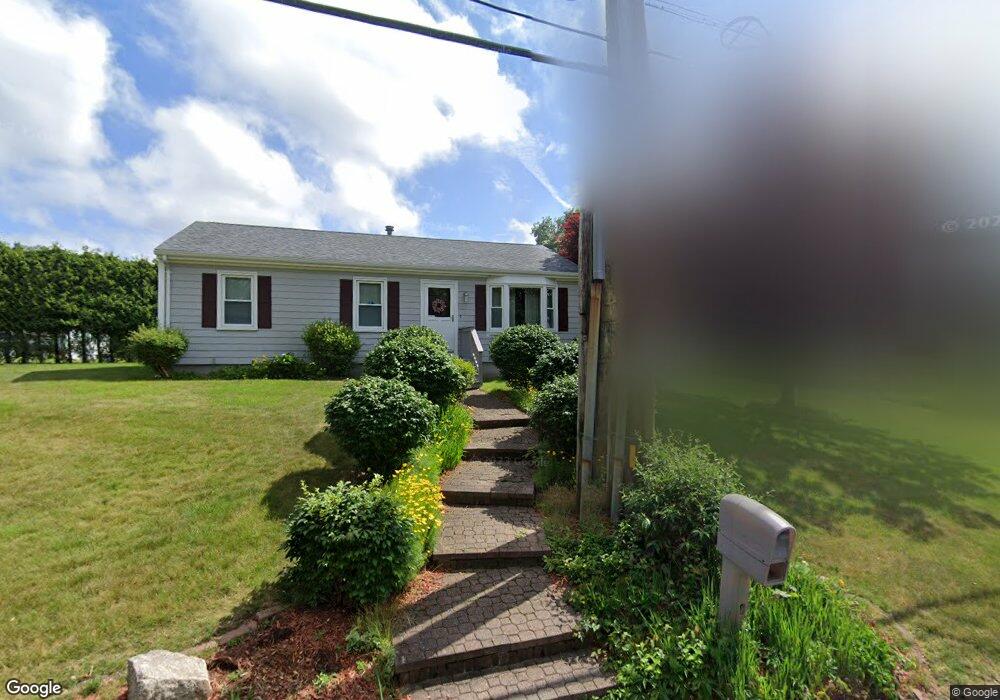
About This Home
This home is located at 1 Marco Ct, Fall River, MA 02720 and is currently estimated at $464,144, approximately $302 per square foot. 1 Marco Ct is a home located in Bristol County with nearby schools including James Tansey Elementary School, Morton Middle School, and B M C Durfee High School.
Ownership History
We collect this data history from publicly available records. To have your information removed, we recommend requesting removal directly through your county’s website.
Purchase Details
Home Financials for this Owner
Home Financials are based on the most recent Mortgage that was taken out on this home.Home Values in the Area
Average Home Value in this Area
Purchase History
We collect this data history from publicly available records. To have your information removed, we recommend requesting removal directly through your county’s website.
| Date | Buyer | Sale Price | Title Company |
|---|---|---|---|
| $135,000 | -- | ||
| $135,000 | -- |
Mortgage History
We collect this data history from publicly available records. To have your information removed, we recommend requesting removal directly through your county’s website.
| Date | Status | Borrower | Loan Amount |
|---|---|---|---|
| Open | $150,000 | ||
| Closed | $25,145 |
Tax History
We collect this data history from publicly available records. To have your information removed, we recommend requesting removal directly through your county’s website.
| Year | Tax Paid | Tax Assessment Tax Assessment Total Assessment is a certain percentage of the fair market value that is determined by local assessors to be the total taxable value of land and additions on the property. | Land | Improvement |
|---|---|---|---|---|
| 2025 | $3,479 | $303,800 | $128,200 | $175,600 |
| 2024 | $3,296 | $286,900 | $125,700 | $161,200 |
| 2023 | $3,368 | $274,500 | $113,200 | $161,300 |
| 2022 | $3,031 | $240,200 | $106,800 | $133,400 |
| 2021 | $3,000 | $216,900 | $102,100 | $114,800 |
| 2020 | $2,958 | $204,700 | $97,400 | $107,300 |
| 2019 | $2,985 | $204,700 | $101,800 | $102,900 |
| 2018 | $2,950 | $201,800 | $100,200 | $101,600 |
| 2017 | $2,799 | $199,900 | $100,200 | $99,700 |
| 2016 | $2,712 | $199,000 | $105,400 | $93,600 |
| 2015 | $2,634 | $201,400 | $105,400 | $96,000 |
| 2014 | $2,534 | $201,400 | $105,400 | $96,000 |
Map
- 793 Montgomery St
- 1163 New Boston Rd
- 1243 New Boston Rd
- 488 Montgomery St
- 12 Goddard St
- 0 Archer St
- 250 Rich St
- 604 Woodlawn St
- 32 Oakland St
- 79 Woodlawn St
- 188 Archer St
- 1800 Robeson St
- 1984 Robeson St
- 277 Valentine St
- 45 Archer St
- 200 Highcrest Rd
- 333 Langley St
- 585 N Eastern Ave
- 554 Madison St
- 65-67 Farnham St
- 11 Marco Ct
- 1273 Langley St
- 1201 Langley St
- 1165 Langley St
- 1135 Langley St
- 1393 Langley St
- 641 Elsbree St
- 651 Elsbree St
- 675 Elsbree St
- 593 Elsbree St
- 575 Elsbree St
- 1111 Langley St
- 1132 Langley St
- 555 Elsbree St
- 669 Nichols St
- 1371 Langley St
- 1375 Langley St
- 1373 Langley St
- 1110 Langley St
- 1103 Langley St
Ask me questions while you tour the home.