1 Niantic Rd Sharon, MA 02067
Estimated Value: $996,000 - $1,206,000
About This Home
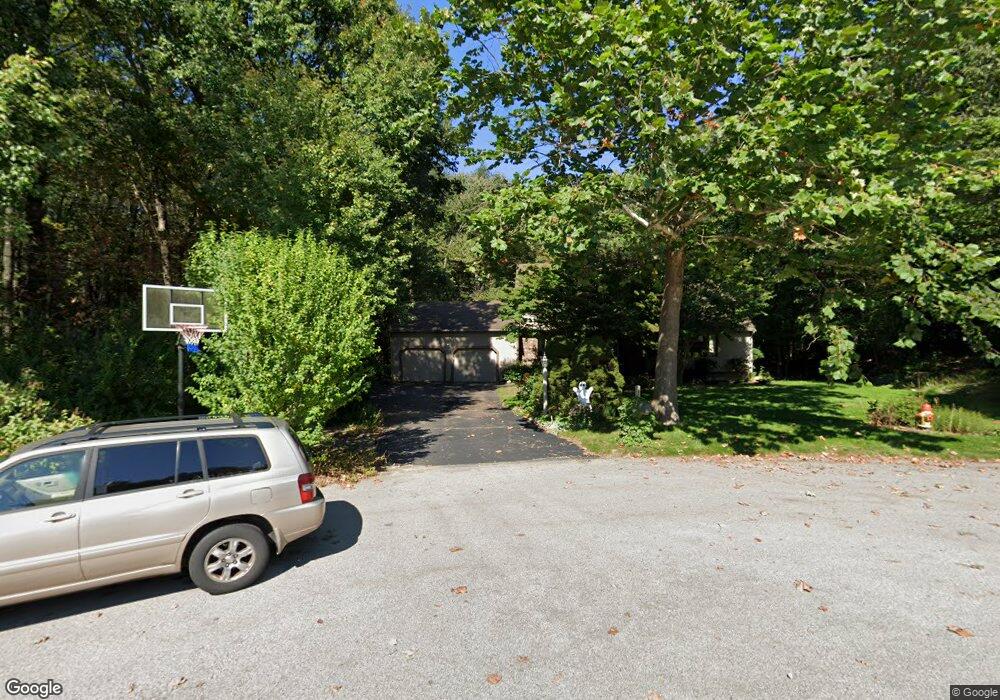
This home is located at 1 Niantic Rd, Sharon, MA 02067 and is currently estimated at $1,086,325, approximately $443 per square foot. 1 Niantic Rd is a home located in Norfolk County with nearby schools including Heights Elementary School, Sharon Middle School, and Sharon High School.
Ownership History
We collect this data history from publicly available records. To have your information removed, we recommend requesting removal directly through your county’s website.
Purchase Details
Home Values in the Area
Average Home Value in this Area
Purchase History
We collect this data history from publicly available records. To have your information removed, we recommend requesting removal directly through your county’s website.
| Date | Buyer | Sale Price | Title Company |
|---|---|---|---|
| $465,900 | -- |
Mortgage History
We collect this data history from publicly available records. To have your information removed, we recommend requesting removal directly through your county’s website.
| Date | Status | Borrower | Loan Amount |
|---|---|---|---|
| Open | $300,000 | ||
| Closed | $300,000 |
Tax History
We collect this data history from publicly available records. To have your information removed, we recommend requesting removal directly through your county’s website.
| Year | Tax Paid | Tax Assessment Tax Assessment Total Assessment is a certain percentage of the fair market value that is determined by local assessors to be the total taxable value of land and additions on the property. | Land | Improvement |
|---|---|---|---|---|
| 2025 | $15,514 | $887,500 | $427,400 | $460,100 |
| 2024 | $14,843 | $844,300 | $392,100 | $452,200 |
| 2023 | $14,102 | $758,600 | $366,600 | $392,000 |
| 2022 | $13,400 | $678,500 | $305,400 | $373,100 |
| 2021 | $13,277 | $649,900 | $288,100 | $361,800 |
| 2020 | $12,348 | $649,900 | $288,100 | $361,800 |
| 2019 | $12,483 | $643,100 | $254,900 | $388,200 |
| 2018 | $12,362 | $638,200 | $250,000 | $388,200 |
| 2017 | $12,204 | $622,000 | $233,800 | $388,200 |
| 2016 | $11,825 | $588,000 | $233,800 | $354,200 |
| 2015 | $11,248 | $554,100 | $214,400 | $339,700 |
| 2014 | $10,429 | $507,500 | $194,900 | $312,600 |
Map
- 54 Barefoot Hill Rd
- 28 Colburn Dr
- 41 Essex Rd
- Lot One Old Wolomolopoag St
- Lot Two Old Wolomolopoag St
- 22 Middlesex Rd
- 11 Black Elk Rd
- 21 Clarke St
- 7 Laurel Rd
- 127R Beach St
- 12 Iron Hollow Rd
- 6 Sandy Ridge Cir
- 11 Cow Hill Rd
- 8 Weyman Ln
- 40 Gunhouse St
- 120 S Walpole St
- 31 Atherton Rd
- 180 Old Post Rd Unit 203
- 24 Pleasant Park Rd
- 178 Morse St
Ask me questions while you tour the home.