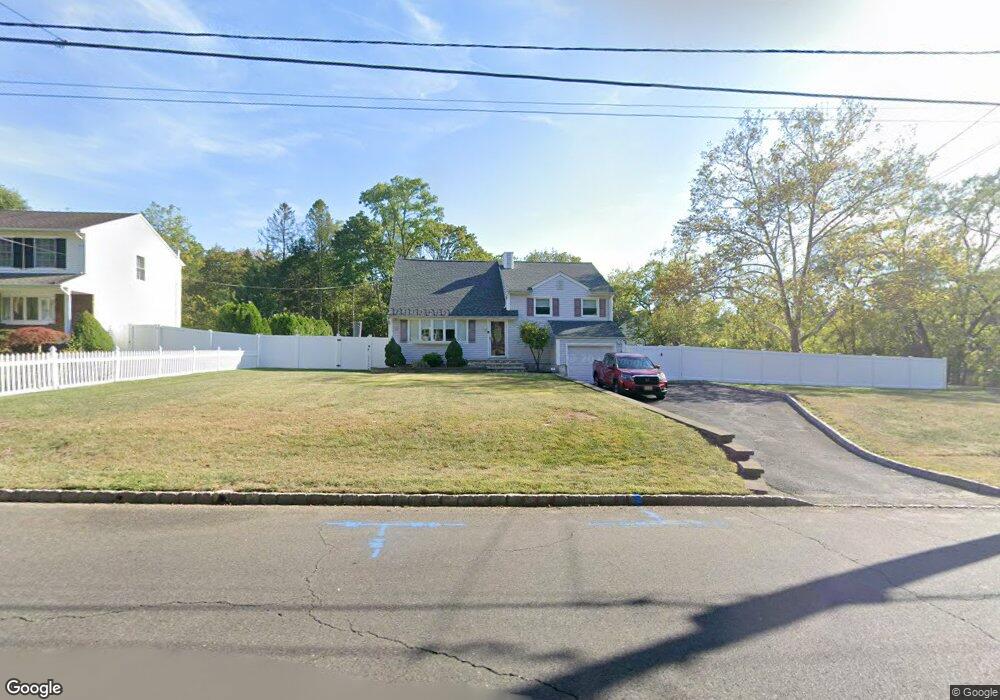
1 Overbrook Rd Piscataway, NJ 08854
Estimated Value: $563,178 - $621,000
Studio
--
Bath
1,828
Sq Ft
$329/Sq Ft
Est. Value
About This Home
This home is located at 1 Overbrook Rd, Piscataway, NJ 08854 and is currently estimated at $601,045, approximately $328 per square foot. 1 Overbrook Rd is a home located in Middlesex County with nearby schools including Martin Luther King Intermediate School, Knollwood Elementary School, and Conackamack Middle School.
Ownership History
Date
Name
Owned For
Owner Type
Purchase Details
Closed on
Oct 9, 2020
Sold by
Andriola Ann Marie and Freeman Kevin M
Bought by
Freeman Kevin M and Freeman Ann Marie
Current Estimated Value
Home Financials for this Owner
Home Financials are based on the most recent Mortgage that was taken out on this home.
Original Mortgage
$294,880
Outstanding Balance
$206,099
Interest Rate
2.3%
Mortgage Type
New Conventional
Estimated Equity
$394,946
Purchase Details
Closed on
Nov 17, 1989
Bought by
Freeman Kevin M and Ndriola,Ann Marie
Create a Home Valuation Report for This Property
The Home Valuation Report is an in-depth analysis detailing your home's value as well as a comparison with similar homes in the area
Home Values in the Area
Average Home Value in this Area
Purchase History
| Date | Buyer | Sale Price | Title Company |
|---|---|---|---|
| Freeman Kevin M | -- | Title365 | |
| Freeman Kevin M | $147,000 | -- |
Source: Public Records
Mortgage History
| Date | Status | Borrower | Loan Amount |
|---|---|---|---|
| Open | Freeman Kevin M | $294,880 |
Source: Public Records
Tax History
| Year | Tax Paid | Tax Assessment Tax Assessment Total Assessment is a certain percentage of the fair market value that is determined by local assessors to be the total taxable value of land and additions on the property. | Land | Improvement |
|---|---|---|---|---|
| 2025 | $9,231 | $526,700 | $317,100 | $209,600 |
| 2024 | $9,311 | $471,700 | $204,600 | $267,100 |
| 2023 | $9,311 | $445,500 | $204,600 | $240,900 |
| 2022 | $8,918 | $396,000 | $204,600 | $191,400 |
| 2021 | $8,804 | $375,900 | $204,600 | $171,300 |
| 2020 | $8,470 | $362,600 | $204,600 | $158,000 |
| 2019 | $8,727 | $367,300 | $204,600 | $162,700 |
| 2018 | $8,485 | $357,700 | $204,600 | $153,100 |
| 2017 | $7,913 | $288,700 | $159,600 | $129,100 |
| 2016 | $7,766 | $288,700 | $159,600 | $129,100 |
| 2015 | $7,656 | $288,700 | $159,600 | $129,100 |
| 2014 | $7,483 | $288,700 | $159,600 | $129,100 |
Source: Public Records
Map
Nearby Homes
Your Personal Tour Guide
Ask me questions while you tour the home.