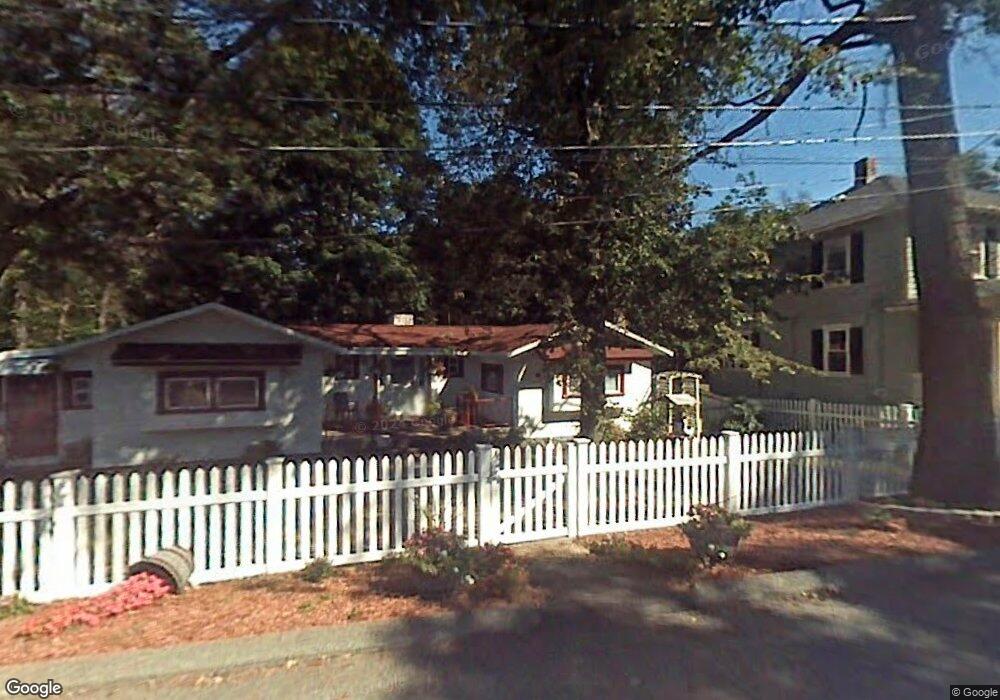
1 Sidney St Wakefield, MA 01880
Greenwood NeighborhoodEstimated Value: $416,000 - $641,000
2
Beds
2
Baths
990
Sq Ft
$488/Sq Ft
Est. Value
About This Home
This home is located at 1 Sidney St, Wakefield, MA 01880 and is currently estimated at $483,282, approximately $488 per square foot. 1 Sidney St is a home located in Middlesex County with nearby schools including Wakefield Memorial High School, St Joseph School, and St. Patrick Elementary School.
Ownership History
Date
Name
Owned For
Owner Type
Purchase Details
Closed on
Jun 25, 2009
Sold by
Lynch John F
Bought by
Lynch John F
Current Estimated Value
Home Financials for this Owner
Home Financials are based on the most recent Mortgage that was taken out on this home.
Original Mortgage
$227,800
Outstanding Balance
$144,471
Interest Rate
4.92%
Mortgage Type
Purchase Money Mortgage
Estimated Equity
$338,811
Create a Home Valuation Report for This Property
The Home Valuation Report is an in-depth analysis detailing your home's value as well as a comparison with similar homes in the area
Home Values in the Area
Average Home Value in this Area
Purchase History
We collect this data history from publicly available records. To have your information removed, we recommend requesting removal directly through your county’s website.
| Date | Buyer | Sale Price | Title Company |
|---|---|---|---|
| Lynch John F | -- | -- |
Source: Public Records
Mortgage History
We collect this data history from publicly available records. To have your information removed, we recommend requesting removal directly through your county’s website.
| Date | Status | Borrower | Loan Amount |
|---|---|---|---|
| Open | Lynch John F | $227,800 |
Source: Public Records
Tax History
| Year | Tax Paid | Tax Assessment Tax Assessment Total Assessment is a certain percentage of the fair market value that is determined by local assessors to be the total taxable value of land and additions on the property. | Land | Improvement |
|---|---|---|---|---|
| 2025 | $6,744 | $594,200 | $364,400 | $229,800 |
| 2024 | $6,222 | $553,100 | $339,000 | $214,100 |
| 2023 | $6,059 | $516,500 | $316,400 | $200,100 |
| 2022 | $5,687 | $461,600 | $282,500 | $179,100 |
| 2021 | $5,503 | $432,300 | $258,300 | $174,000 |
| 2020 | $5,176 | $405,300 | $242,200 | $163,100 |
| 2019 | $4,852 | $378,200 | $226,000 | $152,200 |
| 2018 | $4,680 | $361,400 | $215,900 | $145,500 |
| 2017 | $4,402 | $337,800 | $201,800 | $136,000 |
| 2016 | $4,465 | $331,000 | $199,200 | $131,800 |
| 2015 | $4,173 | $309,600 | $186,200 | $123,400 |
| 2014 | $3,861 | $302,100 | $181,600 | $120,500 |
Source: Public Records
Map
Nearby Homes
- 2 Gates Ln Unit B
- 6 Atwood St
- 1 Traverse St Unit E
- 8 Everett St
- 9 Hart St
- 5 Ballister St Unit 523
- 19 Wakefield Ave
- 62 Foundry St Unit 312
- 62 Foundry St Unit 315
- 62 Foundry St Unit 505
- 62 Foundry St Unit 305
- 62 Foundry St Unit 202
- 7 Ballister St Unit 428
- 11 Columbia Rd Unit 8
- 175 North Ave Unit 407
- 4 Wakefield Ave Unit 4
- 248 Albion St Unit 324
- 248 Albion St Unit 315
- 12 Lovis Ave
- 293 Albion St
Your Personal Tour Guide
Ask me questions while you tour the home.