1 Sloop Ct Barnegat, NJ 08005
Barnegat Township NeighborhoodEstimated Value: $426,761 - $470,000
4
Beds
3
Baths
1,906
Sq Ft
$233/Sq Ft
Est. Value
About This Home
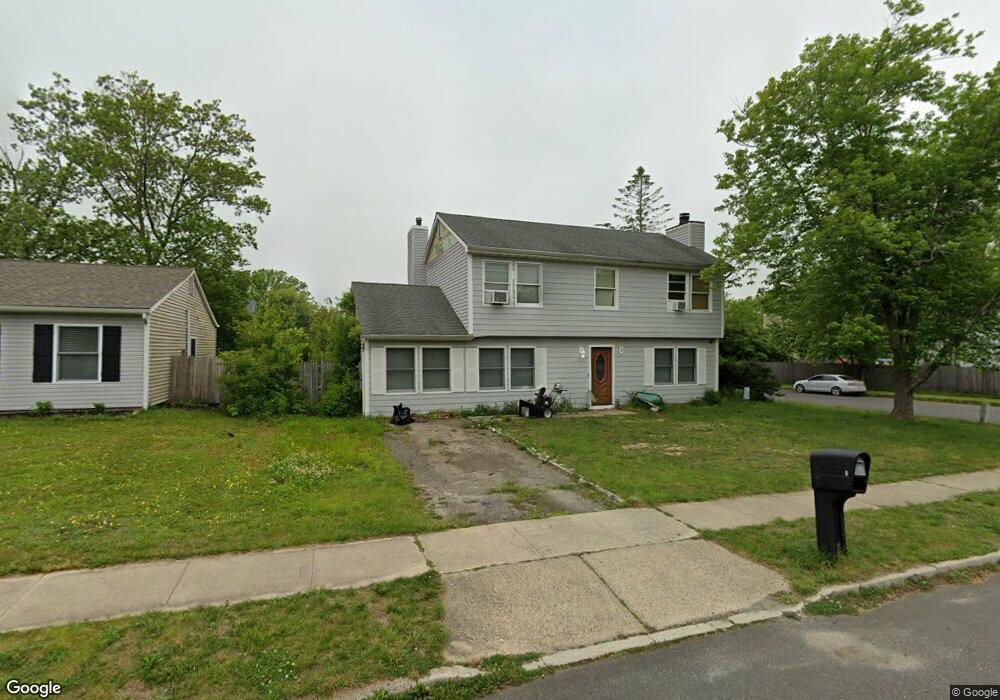
This home is located at 1 Sloop Ct, Barnegat, NJ 08005 and is currently estimated at $443,190, approximately $232 per square foot. 1 Sloop Ct is a home located in Ocean County with nearby schools including Barnegat High School and Lighthouse Christian Academy.
Ownership History
Date
Name
Owned For
Owner Type
Purchase Details
Closed on
Mar 13, 2023
Sold by
Finucan John C and Finucan Arlene
Bought by
Finucan John C and Finucan Arlene
Current Estimated Value
Home Financials for this Owner
Home Financials are based on the most recent Mortgage that was taken out on this home.
Original Mortgage
$144,485
Outstanding Balance
$139,941
Interest Rate
6.12%
Mortgage Type
FHA
Estimated Equity
$303,249
Purchase Details
Closed on
Dec 5, 1997
Sold by
Federal National Mortgage Association
Bought by
Finucan John C and Richardson Arlene
Home Financials for this Owner
Home Financials are based on the most recent Mortgage that was taken out on this home.
Original Mortgage
$83,333
Interest Rate
7.14%
Mortgage Type
FHA
Create a Home Valuation Report for This Property
The Home Valuation Report is an in-depth analysis detailing your home's value as well as a comparison with similar homes in the area
Home Values in the Area
Average Home Value in this Area
Purchase History
| Date | Buyer | Sale Price | Title Company |
|---|---|---|---|
| Finucan John C | -- | -- | |
| Finucan John C | $82,500 | -- |
Source: Public Records
Mortgage History
| Date | Status | Borrower | Loan Amount |
|---|---|---|---|
| Open | Finucan John C | $144,485 | |
| Previous Owner | Finucan John C | $83,333 |
Source: Public Records
Tax History
| Year | Tax Paid | Tax Assessment Tax Assessment Total Assessment is a certain percentage of the fair market value that is determined by local assessors to be the total taxable value of land and additions on the property. | Land | Improvement |
|---|---|---|---|---|
| 2025 | $5,528 | $179,300 | $68,800 | $110,500 |
| 2024 | $5,219 | $179,300 | $68,800 | $110,500 |
| 2023 | $5,051 | $179,300 | $68,800 | $110,500 |
| 2022 | $5,051 | $179,300 | $68,800 | $110,500 |
| 2021 | $5,028 | $179,300 | $68,800 | $110,500 |
| 2020 | $5,004 | $179,300 | $68,800 | $110,500 |
| 2019 | $4,931 | $179,300 | $68,800 | $110,500 |
| 2018 | $4,893 | $179,300 | $68,800 | $110,500 |
| 2017 | $4,812 | $179,300 | $68,800 | $110,500 |
| 2016 | $4,714 | $179,300 | $68,800 | $110,500 |
| 2015 | $4,565 | $179,300 | $68,800 | $110,500 |
| 2014 | $4,448 | $179,300 | $68,800 | $110,500 |
Source: Public Records
Map
Nearby Homes
- 56 Village Dr
- 4 Mast Dr
- 7 Shelli Terrace
- 69 Schooner Ave
- 19 Midship Dr
- 21 Potomac Ct
- 17 Windward Dr
- 7 Sovereign Rd
- 88 Lexington Blvd
- 43 Osprey Place
- 22 Lexington Blvd
- 2 Admiral Ct
- 129 Village Dr
- 15 Commodore Ct
- 198 Village Dr
- 6 Surf Ct
- 135 Windward Dr
- 74 Barnegat Blvd S
- 91 Robin Ln
- 83 Georgetown Blvd
Your Personal Tour Guide
Ask me questions while you tour the home.