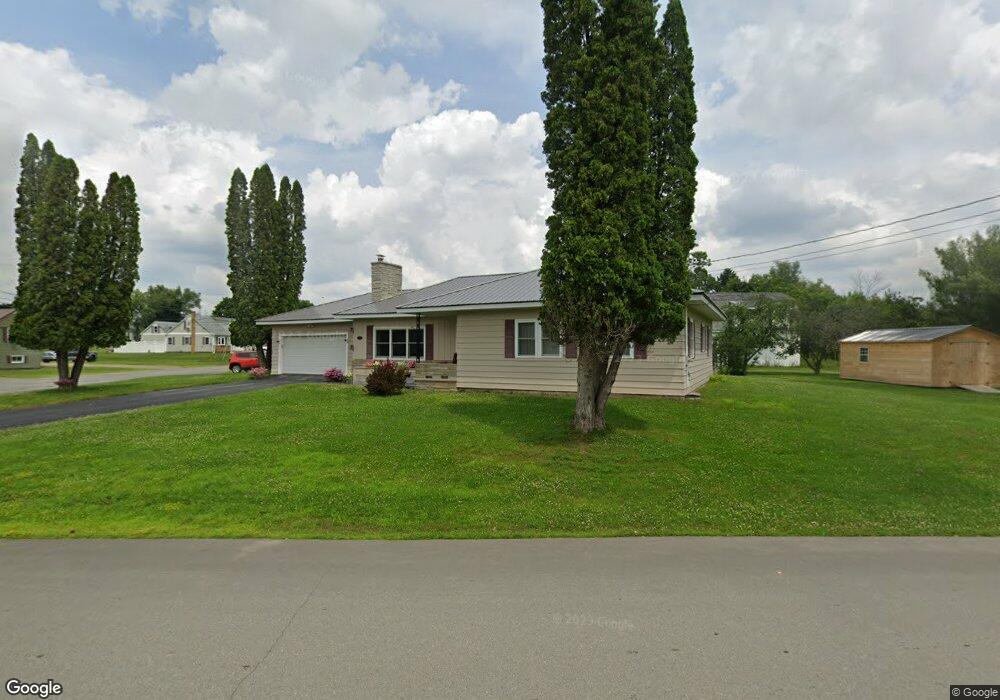
1 Spring St East Millinocket, ME 04430
Estimated Value: $168,000 - $189,000
4
Beds
2
Baths
1,902
Sq Ft
$96/Sq Ft
Est. Value
About This Home
This home is located at 1 Spring St, East Millinocket, ME 04430 and is currently estimated at $181,777, approximately $95 per square foot. 1 Spring St is a home located in Penobscot County with nearby schools including Opal Myrick Elementary School and Schenck High School.
Ownership History
Date
Name
Owned For
Owner Type
Purchase Details
Closed on
May 17, 2011
Sold by
Majkowski Ronald P and Majkowski Susan L
Bought by
Dumais Allen and Dumais Christine
Current Estimated Value
Home Financials for this Owner
Home Financials are based on the most recent Mortgage that was taken out on this home.
Original Mortgage
$93,551
Outstanding Balance
$63,614
Interest Rate
4.88%
Mortgage Type
Commercial
Estimated Equity
$118,163
Purchase Details
Closed on
Oct 6, 2006
Sold by
Sfjv-2003-1 Llc
Bought by
Props Asset Mgmt Inc and Majkowski Susan L
Create a Home Valuation Report for This Property
The Home Valuation Report is an in-depth analysis detailing your home's value as well as a comparison with similar homes in the area
Home Values in the Area
Average Home Value in this Area
Purchase History
| Date | Buyer | Sale Price | Title Company |
|---|---|---|---|
| Dumais Allen | -- | -- | |
| Dumais Allen | -- | -- | |
| Dumais Allen | -- | -- | |
| Props Asset Mgmt Inc | -- | -- | |
| Majkowski Ronald P | -- | -- | |
| Props Asset Mgmt Inc | -- | -- |
Source: Public Records
Mortgage History
| Date | Status | Borrower | Loan Amount |
|---|---|---|---|
| Open | Props Asset Mgmt Inc | $93,551 | |
| Closed | Props Asset Mgmt Inc | $93,551 |
Source: Public Records
Tax History
| Year | Tax Paid | Tax Assessment Tax Assessment Total Assessment is a certain percentage of the fair market value that is determined by local assessors to be the total taxable value of land and additions on the property. | Land | Improvement |
|---|---|---|---|---|
| 2025 | $3,777 | $99,400 | $7,400 | $92,000 |
| 2024 | $3,330 | $99,400 | $7,400 | $92,000 |
| 2023 | $2,503 | $75,383 | $5,696 | $69,687 |
| 2022 | $2,503 | $75,383 | $5,696 | $69,687 |
| 2021 | $2,503 | $75,383 | $5,696 | $69,687 |
| 2020 | $2,427 | $75,383 | $5,696 | $69,687 |
| 2019 | $2,280 | $75,383 | $5,696 | $69,687 |
| 2018 | $2,431 | $75,383 | $5,696 | $69,687 |
| 2017 | $2,525 | $75,383 | $5,696 | $69,687 |
| 2016 | $2,318 | $75,383 | $5,696 | $69,687 |
| 2015 | $2,236 | $75,383 | $5,696 | $69,687 |
| 2014 | $2,151 | $75,383 | $5,696 | $69,687 |
| 2013 | $1,857 | $84,700 | $6,400 | $78,300 |
Source: Public Records
Map
Nearby Homes
Your Personal Tour Guide
Ask me questions while you tour the home.