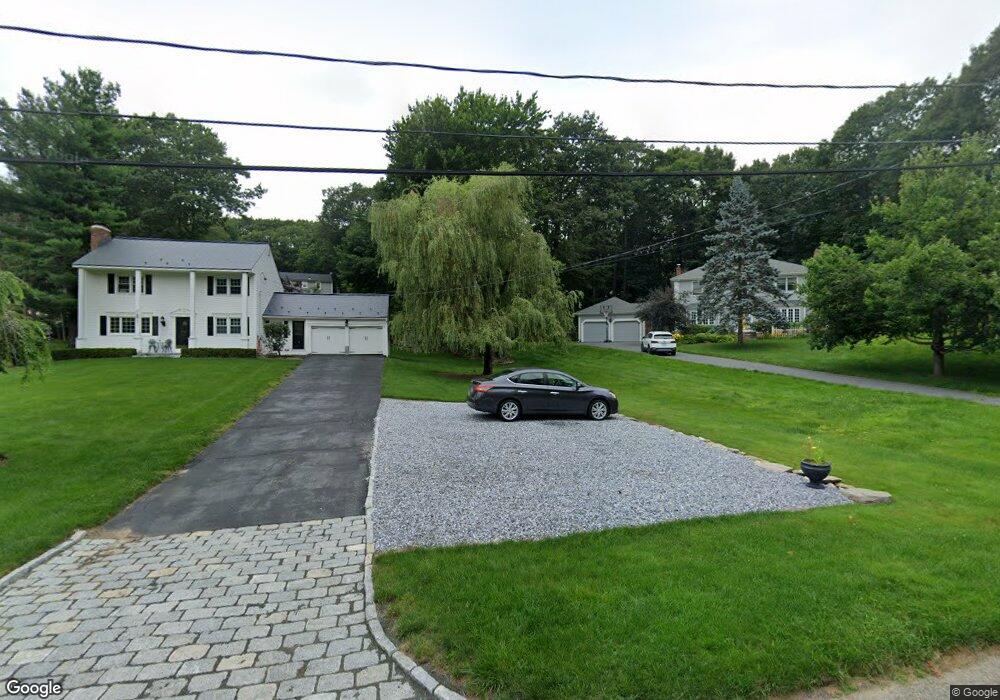
1 Squantum Rd Paxton, MA 01612
Estimated Value: $510,086 - $587,000
4
Beds
2
Baths
1,826
Sq Ft
$304/Sq Ft
Est. Value
About This Home
This home is located at 1 Squantum Rd, Paxton, MA 01612 and is currently estimated at $555,772, approximately $304 per square foot. 1 Squantum Rd is a home located in Worcester County with nearby schools including Wachusett Regional High School and Worcester Seventh-Day Adventist School.
Ownership History
Date
Name
Owned For
Owner Type
Purchase Details
Closed on
Jan 31, 2019
Sold by
Smith Thomas J and Smith Audra R
Bought by
Smith Ft
Current Estimated Value
Purchase Details
Closed on
Apr 30, 1998
Sold by
Meer Thomas S and Meer Karen J
Bought by
Smith Thomas J and Smith Audra R
Purchase Details
Closed on
Jun 20, 1994
Sold by
Sjosten David A and Sjosten Arlene
Bought by
Meer Thomas S
Create a Home Valuation Report for This Property
The Home Valuation Report is an in-depth analysis detailing your home's value as well as a comparison with similar homes in the area
Home Values in the Area
Average Home Value in this Area
Purchase History
| Date | Buyer | Sale Price | Title Company |
|---|---|---|---|
| Smith Ft | -- | -- | |
| Smith Thomas J | $157,000 | -- | |
| Meer Thomas S | $146,000 | -- |
Source: Public Records
Mortgage History
| Date | Status | Borrower | Loan Amount |
|---|---|---|---|
| Previous Owner | Meer Thomas S | $134,229 | |
| Previous Owner | Meer Thomas S | $181,727 | |
| Previous Owner | Meer Thomas S | $25,000 |
Source: Public Records
Tax History
| Year | Tax Paid | Tax Assessment Tax Assessment Total Assessment is a certain percentage of the fair market value that is determined by local assessors to be the total taxable value of land and additions on the property. | Land | Improvement |
|---|---|---|---|---|
| 2025 | $6,640 | $450,500 | $114,200 | $336,300 |
| 2024 | $6,865 | $427,200 | $114,200 | $313,000 |
| 2023 | $6,614 | $376,200 | $103,800 | $272,400 |
| 2022 | $6,277 | $330,700 | $103,800 | $226,900 |
| 2021 | $5,893 | $298,700 | $94,600 | $204,100 |
| 2020 | $5,724 | $290,100 | $86,000 | $204,100 |
| 2019 | $5,571 | $282,200 | $78,100 | $204,100 |
| 2018 | $5,007 | $245,100 | $71,000 | $174,100 |
| 2017 | $4,820 | $236,400 | $67,600 | $168,800 |
| 2016 | $4,520 | $219,500 | $67,600 | $151,900 |
| 2015 | $4,385 | $210,900 | $67,600 | $143,300 |
| 2014 | $4,252 | $207,300 | $67,600 | $139,700 |
Source: Public Records
Map
Nearby Homes
- 309 Pleasant St
- 11 Walbridge Rd
- 4 Crestwood Rd
- 2 Crestwood Rd
- 78 Asnebumskit Rd
- 45 Sussex Ln
- 407 Mower St
- 9 Forestdale Rd
- 40 Chatanika Ave
- 620 Pleasant St
- 3 Sherbrooke Dr
- 72 Holden Rd
- 148A Tory Fort Ln
- 8 Cir
- 306 Fisher Rd
- 44 Drexel St
- 5 Chartwell Ln Unit 87
- 9 Briarcliff St
- 14 Baiting Brook Ln Unit 65
- 16 Baiting Brook Ln Unit 64
Your Personal Tour Guide
Ask me questions while you tour the home.