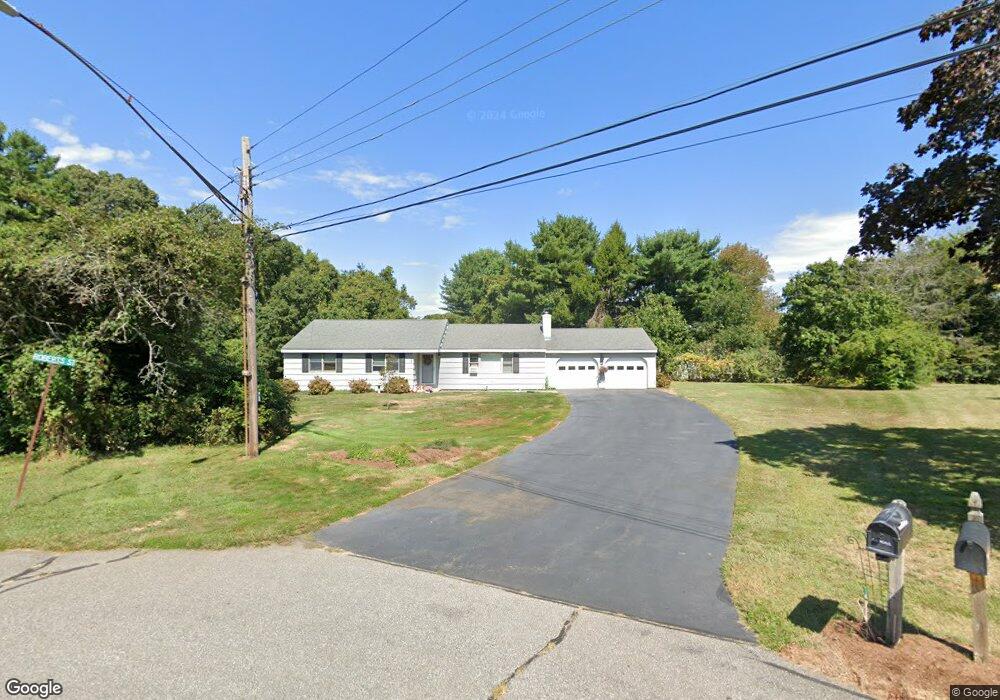
10 Allen St Old Saybrook, CT 06475
Estimated Value: $660,000 - $840,000
3
Beds
2
Baths
1,508
Sq Ft
$490/Sq Ft
Est. Value
About This Home
This home is located at 10 Allen St, Old Saybrook, CT 06475 and is currently estimated at $738,904, approximately $489 per square foot. 10 Allen St is a home located in Middlesex County with nearby schools including Kathleen E. Goodwin School, Old Saybrook Middle School, and Old Saybrook Senior High School.
Ownership History
Date
Name
Owned For
Owner Type
Purchase Details
Closed on
Oct 31, 1988
Sold by
Morse Robert E
Bought by
Nash Bruce E J
Current Estimated Value
Create a Home Valuation Report for This Property
The Home Valuation Report is an in-depth analysis detailing your home's value as well as a comparison with similar homes in the area
Home Values in the Area
Average Home Value in this Area
Purchase History
We collect this data history from publicly available records. To have your information removed, we recommend requesting removal directly through your county’s website.
| Date | Buyer | Sale Price | Title Company |
|---|---|---|---|
| Nash Bruce E J | $206,000 | -- |
Source: Public Records
Mortgage History
We collect this data history from publicly available records. To have your information removed, we recommend requesting removal directly through your county’s website.
| Date | Status | Borrower | Loan Amount |
|---|---|---|---|
| Open | Nash Bruce E J | $200,000 | |
| Closed | Nash Bruce E J | $50,000 | |
| Closed | Nash Bruce E J | $25,000 |
Source: Public Records
Tax History
| Year | Tax Paid | Tax Assessment Tax Assessment Total Assessment is a certain percentage of the fair market value that is determined by local assessors to be the total taxable value of land and additions on the property. | Land | Improvement |
|---|---|---|---|---|
| 2025 | $5,899 | $380,600 | $123,200 | $257,400 |
| 2024 | $5,785 | $380,600 | $123,200 | $257,400 |
| 2023 | $5,454 | $266,700 | $97,200 | $169,500 |
| 2022 | $5,355 | $266,700 | $97,200 | $169,500 |
| 2021 | $5,347 | $266,700 | $97,200 | $169,500 |
| 2020 | $5,347 | $266,700 | $97,200 | $169,500 |
| 2019 | $5,267 | $266,700 | $97,200 | $169,500 |
| 2018 | $5,155 | $263,000 | $111,900 | $151,100 |
| 2017 | $5,171 | $263,000 | $111,900 | $151,100 |
| 2016 | $5,065 | $263,000 | $111,900 | $151,100 |
| 2015 | $4,388 | $233,300 | $82,200 | $151,100 |
| 2014 | $4,316 | $233,300 | $82,200 | $151,100 |
Source: Public Records
Map
Nearby Homes
- 71 Maple Ave
- 14 Cedarwood Ln
- 1 Beamon Meadow Place
- 104 Knollwood Dr
- 446 Main St Unit 9
- 41 Farview Ave
- 124 Old Boston Post Rd
- 5 Woodland Dr
- 129 Old Boston Post Rd
- 382 Maple Ave
- 63 Great Hammock Rd
- 16 Lynde St
- 24 Cottage Place
- 24 Seabreeze Rd
- 18 Old South Cove Rd
- 2 Old South Cove Rd
- 21 Fenbrook Rd
- 4 Fenwood Ln
- 25 Sunset Rd Unit 7
- 37 Mohican Rd
Your Personal Tour Guide
Ask me questions while you tour the home.