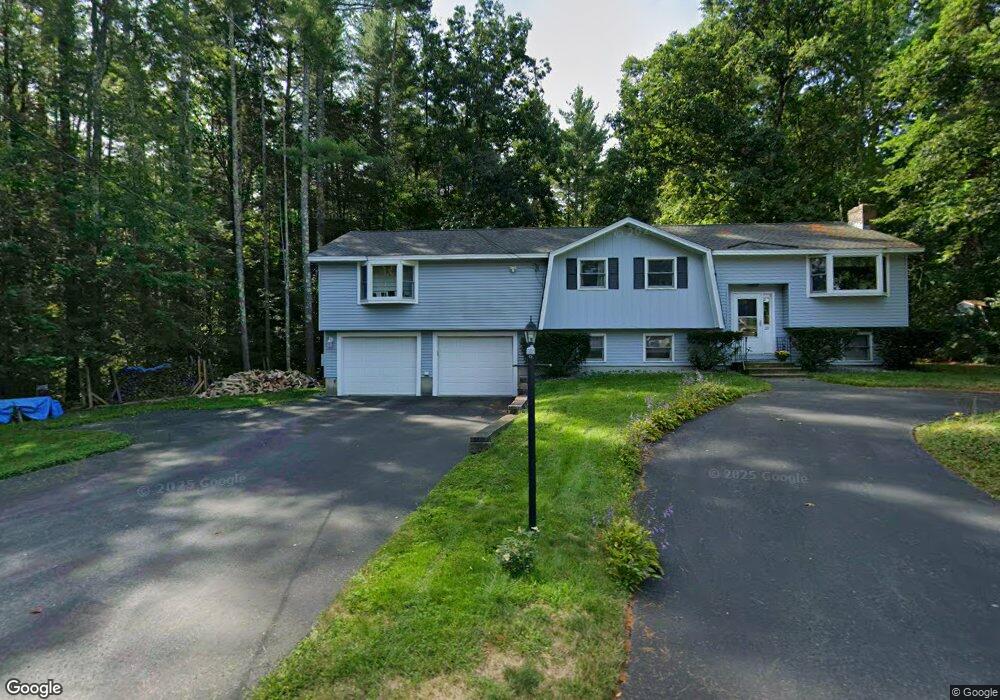
10 Bemis Rd Pepperell, MA 01463
Estimated Value: $583,251 - $658,000
4
Beds
3
Baths
2,164
Sq Ft
$282/Sq Ft
Est. Value
About This Home
This home is located at 10 Bemis Rd, Pepperell, MA 01463 and is currently estimated at $610,563, approximately $282 per square foot. 10 Bemis Rd is a home located in Middlesex County with nearby schools including North Middlesex Regional High School, Pepperell Christian Academy, and Maple Dene & Moppet School.
Ownership History
Date
Name
Owned For
Owner Type
Purchase Details
Closed on
Mar 27, 1987
Sold by
Dumais David P
Bought by
Cacace George M
Current Estimated Value
Home Financials for this Owner
Home Financials are based on the most recent Mortgage that was taken out on this home.
Original Mortgage
$97,900
Interest Rate
9.03%
Mortgage Type
Purchase Money Mortgage
Create a Home Valuation Report for This Property
The Home Valuation Report is an in-depth analysis detailing your home's value as well as a comparison with similar homes in the area
Home Values in the Area
Average Home Value in this Area
Purchase History
| Date | Buyer | Sale Price | Title Company |
|---|---|---|---|
| Cacace George M | $147,900 | -- |
Source: Public Records
Mortgage History
| Date | Status | Borrower | Loan Amount |
|---|---|---|---|
| Open | Cacace George M | $143,000 | |
| Closed | Cacace George M | $103,000 | |
| Closed | Cacace George M | $97,900 |
Source: Public Records
Tax History
| Year | Tax Paid | Tax Assessment Tax Assessment Total Assessment is a certain percentage of the fair market value that is determined by local assessors to be the total taxable value of land and additions on the property. | Land | Improvement |
|---|---|---|---|---|
| 2025 | $6,831 | $466,900 | $143,400 | $323,500 |
| 2024 | $6,241 | $434,900 | $129,700 | $305,200 |
| 2023 | $6,447 | $425,800 | $129,700 | $296,100 |
| 2022 | $6,028 | $351,500 | $102,400 | $249,100 |
| 2021 | $5,955 | $332,300 | $88,800 | $243,500 |
| 2020 | $5,642 | $332,300 | $88,800 | $243,500 |
| 2019 | $5,218 | $314,500 | $88,800 | $225,700 |
| 2018 | $4,791 | $292,300 | $88,800 | $203,500 |
| 2017 | $4,417 | $278,000 | $88,800 | $189,200 |
| 2016 | $4,209 | $254,600 | $88,800 | $165,800 |
| 2015 | $4,061 | $254,600 | $88,800 | $165,800 |
| 2014 | $3,935 | $248,100 | $88,800 | $159,300 |
Source: Public Records
Map
Nearby Homes
Your Personal Tour Guide
Ask me questions while you tour the home.