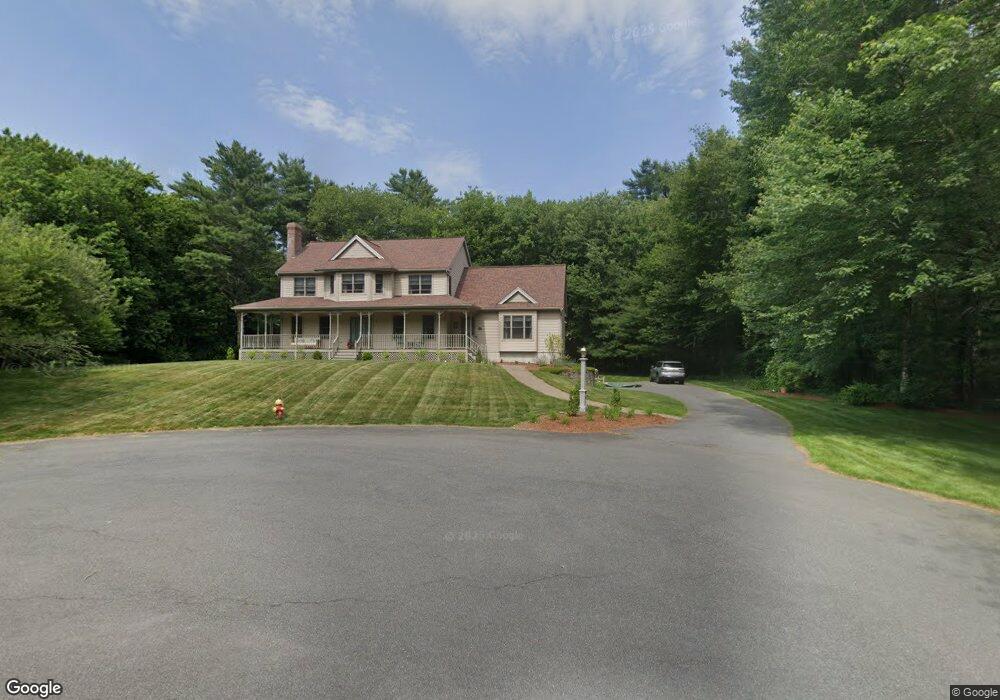
10 Chandler Way Mansfield, MA 02048
Estimated Value: $846,000 - $948,000
About This Home
This home is located at 10 Chandler Way, Mansfield, MA 02048 and is currently estimated at $891,189, approximately $313 per square foot. 10 Chandler Way is a home located in Bristol County with nearby schools including Everett W. Robinson Elementary School, Jordan/Jackson Elementary School, and Harold L. Qualters Middle School.
Ownership History
We collect this data history from publicly available records. To have your information removed, we recommend requesting removal directly through your county’s website.
Purchase Details
Purchase Details
Purchase Details
Home Financials for this Owner
Home Financials are based on the most recent Mortgage that was taken out on this home.Home Values in the Area
Average Home Value in this Area
Purchase History
We collect this data history from publicly available records. To have your information removed, we recommend requesting removal directly through your county’s website.
| Date | Buyer | Sale Price | Title Company |
|---|---|---|---|
| -- | None Available | ||
| -- | None Available | ||
| $89,000 | -- |
Mortgage History
We collect this data history from publicly available records. To have your information removed, we recommend requesting removal directly through your county’s website.
| Date | Status | Borrower | Loan Amount |
|---|---|---|---|
| Previous Owner | $125,000 | ||
| Previous Owner | $110,000 | ||
| Previous Owner | $190,000 |
Tax History
We collect this data history from publicly available records. To have your information removed, we recommend requesting removal directly through your county’s website.
| Year | Tax Paid | Tax Assessment Tax Assessment Total Assessment is a certain percentage of the fair market value that is determined by local assessors to be the total taxable value of land and additions on the property. | Land | Improvement |
|---|---|---|---|---|
| 2025 | $10,025 | $761,200 | $279,800 | $481,400 |
| 2024 | $10,029 | $742,900 | $291,900 | $451,000 |
| 2023 | $9,666 | $686,000 | $291,900 | $394,100 |
| 2022 | $9,279 | $611,700 | $270,200 | $341,500 |
| 2021 | $9,012 | $586,700 | $225,300 | $361,400 |
| 2020 | $5,147 | $577,200 | $225,300 | $351,900 |
| 2019 | $4,172 | $550,500 | $187,600 | $362,900 |
| 2018 | $8,336 | $535,400 | $179,000 | $356,400 |
| 2017 | $3,864 | $520,600 | $173,900 | $346,700 |
| 2016 | $7,494 | $486,300 | $165,500 | $320,800 |
| 2015 | -- | $470,100 | $165,500 | $304,600 |
Map
- 200 Branch St
- 37 Davis St Unit 2
- 69 Union St
- 50 Hope St
- 38 Fruit St
- 95 Samoset Ave
- 5 Juniper Dr
- 387 Willow St
- 179 Dean St
- 13 Shawmut Ave
- 69 Rumford Ave
- 39 Church St
- 3 Morse Ct
- 99 Pleasant St
- 94 Pleasant St
- 22 Pleasant St Unit E
- 158 High St
- 229 Spring St
- 150 Rumford Ave Unit 230
- 150 Rumford Ave Unit 410
Ask me questions while you tour the home.