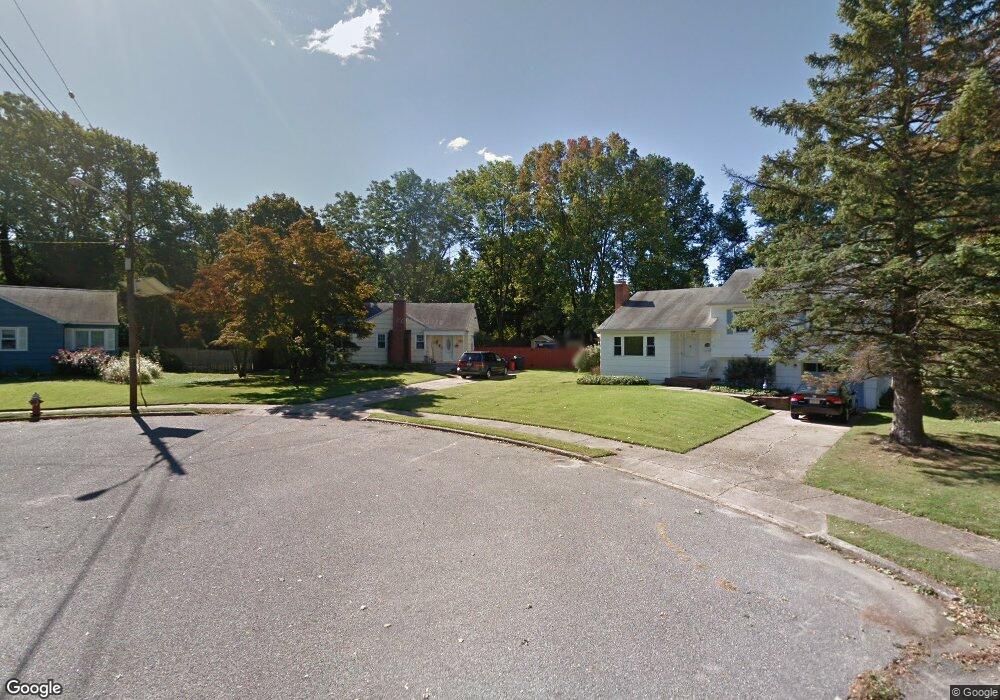
10 Chennault Ct Mount Holly, NJ 08060
Estimated Value: $311,007 - $369,000
Studio
--
Bath
1,140
Sq Ft
$299/Sq Ft
Est. Value
About This Home
This home is located at 10 Chennault Ct, Mount Holly, NJ 08060 and is currently estimated at $340,502, approximately $298 per square foot. 10 Chennault Ct is a home located in Burlington County with nearby schools including John Brainerd Elementary School, Folwell Elementary School, and F.W. Holbein School.
Ownership History
Date
Name
Owned For
Owner Type
Purchase Details
Closed on
Jan 28, 1994
Sold by
D'Eustachio Marjorie
Bought by
Parks George and Parks Valerie Parks
Current Estimated Value
Home Financials for this Owner
Home Financials are based on the most recent Mortgage that was taken out on this home.
Original Mortgage
$103,000
Interest Rate
6.9%
Create a Home Valuation Report for This Property
The Home Valuation Report is an in-depth analysis detailing your home's value as well as a comparison with similar homes in the area
Home Values in the Area
Average Home Value in this Area
Purchase History
| Date | Buyer | Sale Price | Title Company |
|---|---|---|---|
| Parks George | $108,000 | -- |
Source: Public Records
Mortgage History
| Date | Status | Borrower | Loan Amount |
|---|---|---|---|
| Previous Owner | Parks George | $103,000 |
Source: Public Records
Tax History
| Year | Tax Paid | Tax Assessment Tax Assessment Total Assessment is a certain percentage of the fair market value that is determined by local assessors to be the total taxable value of land and additions on the property. | Land | Improvement |
|---|---|---|---|---|
| 2025 | $7,303 | $208,000 | $69,300 | $138,700 |
| 2024 | $6,980 | $208,000 | $69,300 | $138,700 |
| 2023 | $6,980 | $208,000 | $69,300 | $138,700 |
| 2022 | $6,735 | $208,000 | $69,300 | $138,700 |
| 2021 | $6,624 | $208,000 | $69,300 | $138,700 |
| 2020 | $6,367 | $208,000 | $69,300 | $138,700 |
| 2019 | $6,223 | $208,000 | $69,300 | $138,700 |
| 2018 | $6,113 | $208,000 | $69,300 | $138,700 |
| 2017 | $5,955 | $208,000 | $69,300 | $138,700 |
| 2016 | $5,818 | $208,000 | $69,300 | $138,700 |
| 2015 | $5,695 | $208,000 | $69,300 | $138,700 |
| 2014 | $5,485 | $208,000 | $69,300 | $138,700 |
Source: Public Records
Map
Nearby Homes
- 204 Woodpecker Ln
- 207 Canary Ln
- 856 Woodlane Rd
- 115 Ridgway St
- 34 Parliament Dr
- 6 Regency Dr
- 30 Spyglass Ct
- 344 Ridgway St
- 48 Broad St
- 8 Saint Andrews Ct
- 20 Stanton Rd
- 102 Levis Dr
- 142 Cherry St
- 7 Foundry Blvd
- 817 Woodlane Rd
- 124 Mount Holly Ave
- 18 Foundry Blvd
- 119 Buttonwood St
- 35 Beaumont Place
- 220 Garden St
Your Personal Tour Guide
Ask me questions while you tour the home.