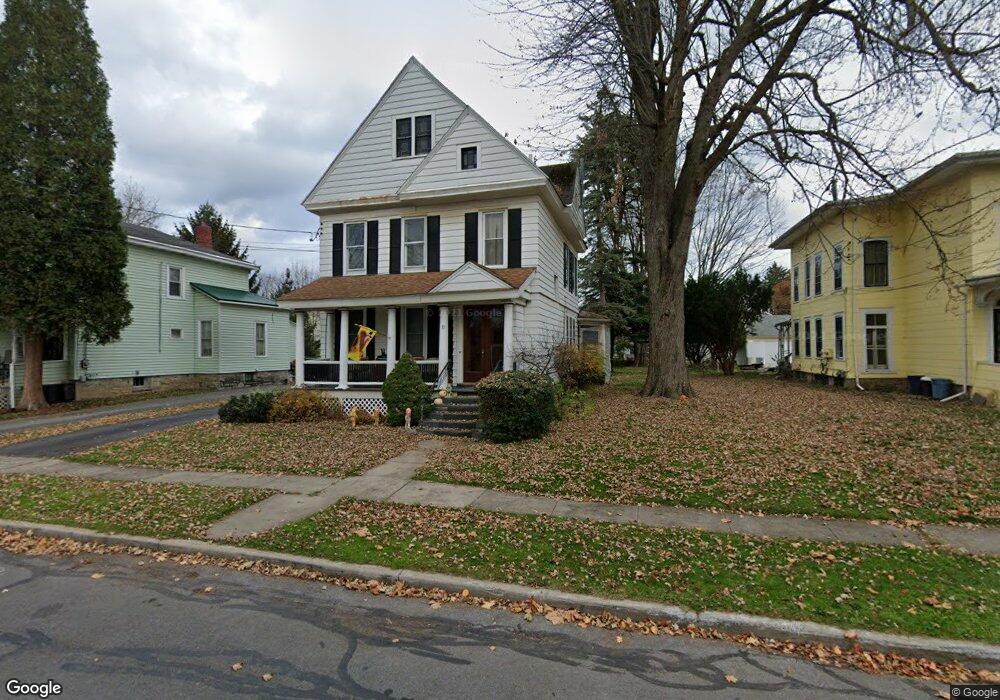
10 Chestnut St Auburn, NY 13021
Estimated Value: $111,870 - $154,000
3
Beds
2
Baths
2,212
Sq Ft
$58/Sq Ft
Est. Value
About This Home
This home is located at 10 Chestnut St, Auburn, NY 13021 and is currently estimated at $128,968, approximately $58 per square foot. 10 Chestnut St is a home located in Cayuga County with nearby schools including Auburn Junior High School, Auburn High School, and St Joseph School.
Ownership History
Date
Name
Owned For
Owner Type
Purchase Details
Closed on
Mar 31, 2025
Sold by
Brennan Cynthia B
Bought by
Pennymac Services Inc
Current Estimated Value
Purchase Details
Closed on
Jan 6, 2006
Sold by
Sanders Steven
Bought by
Hutson Jeremy
Home Financials for this Owner
Home Financials are based on the most recent Mortgage that was taken out on this home.
Original Mortgage
$68,000
Interest Rate
9.15%
Mortgage Type
Adjustable Rate Mortgage/ARM
Purchase Details
Closed on
Jan 18, 1996
Create a Home Valuation Report for This Property
The Home Valuation Report is an in-depth analysis detailing your home's value as well as a comparison with similar homes in the area
Home Values in the Area
Average Home Value in this Area
Purchase History
| Date | Buyer | Sale Price | Title Company |
|---|---|---|---|
| Pennymac Services Inc | $107,500 | None Listed On Document | |
| Hutson Jeremy | $85,000 | Joseph Pettigrass | |
| -- | $58,000 | -- |
Source: Public Records
Mortgage History
| Date | Status | Borrower | Loan Amount |
|---|---|---|---|
| Previous Owner | Hutson Jeremy | $68,000 | |
| Previous Owner | Hutson Jeremy | $17,000 |
Source: Public Records
Tax History
| Year | Tax Paid | Tax Assessment Tax Assessment Total Assessment is a certain percentage of the fair market value that is determined by local assessors to be the total taxable value of land and additions on the property. | Land | Improvement |
|---|---|---|---|---|
| 2025 | $2,630 | $112,800 | $15,700 | $97,100 |
| 2024 | $2,630 | $112,800 | $15,700 | $97,100 |
| 2023 | $2,627 | $112,800 | $15,700 | $97,100 |
| 2022 | $2,144 | $112,800 | $15,700 | $97,100 |
| 2021 | $2,010 | $93,600 | $14,500 | $79,100 |
| 2020 | $1,978 | $93,600 | $14,500 | $79,100 |
| 2019 | $796 | $93,600 | $14,500 | $79,100 |
| 2018 | $1,930 | $93,600 | $14,500 | $79,100 |
| 2017 | $1,990 | $93,000 | $15,200 | $77,800 |
| 2016 | $3,705 | $93,000 | $15,200 | $77,800 |
| 2015 | $1,203 | $93,000 | $15,200 | $77,800 |
| 2014 | $1,203 | $93,000 | $15,200 | $77,800 |
Source: Public Records
Map
Nearby Homes
Your Personal Tour Guide
Ask me questions while you tour the home.