10 Clifton St Quincy, MA 02169
Quincy Center NeighborhoodEstimated Value: $696,098 - $750,000
About This Home
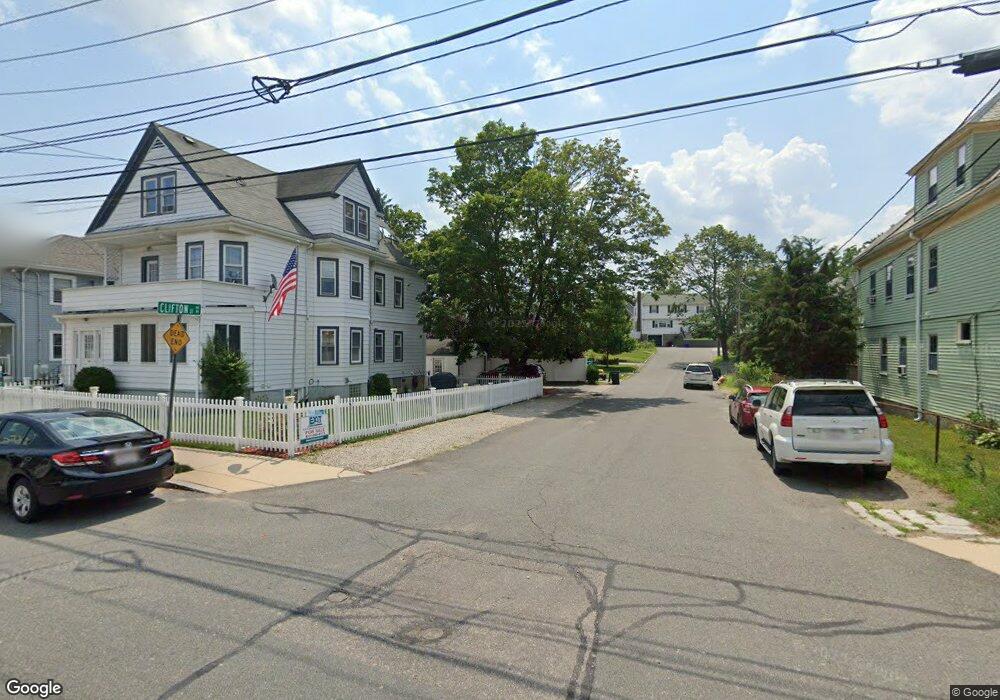
This home is located at 10 Clifton St, Quincy, MA 02169 and is currently estimated at $731,275, approximately $553 per square foot. 10 Clifton St is a home located in Norfolk County with nearby schools including Merrymount Elementary School, Central Middle School, and Quincy High School.
Ownership History
We collect this data history from publicly available records. To have your information removed, we recommend requesting removal directly through your county’s website.
Purchase Details
Home Financials for this Owner
Home Financials are based on the most recent Mortgage that was taken out on this home.Home Values in the Area
Average Home Value in this Area
Purchase History
We collect this data history from publicly available records. To have your information removed, we recommend requesting removal directly through your county’s website.
| Date | Buyer | Sale Price | Title Company |
|---|---|---|---|
| $326,000 | -- |
Mortgage History
We collect this data history from publicly available records. To have your information removed, we recommend requesting removal directly through your county’s website.
| Date | Status | Borrower | Loan Amount |
|---|---|---|---|
| Open | $309,700 |
Tax History
We collect this data history from publicly available records. To have your information removed, we recommend requesting removal directly through your county’s website.
| Year | Tax Paid | Tax Assessment Tax Assessment Total Assessment is a certain percentage of the fair market value that is determined by local assessors to be the total taxable value of land and additions on the property. | Land | Improvement |
|---|---|---|---|---|
| 2025 | $6,813 | $590,900 | $287,100 | $303,800 |
| 2024 | $6,476 | $574,600 | $273,400 | $301,200 |
| 2023 | $5,900 | $530,100 | $248,600 | $281,500 |
| 2022 | $5,979 | $499,100 | $226,000 | $273,100 |
| 2021 | $5,811 | $478,700 | $226,000 | $252,700 |
| 2020 | $5,687 | $457,500 | $215,200 | $242,300 |
| 2019 | $5,230 | $416,700 | $203,000 | $213,700 |
| 2018 | $5,448 | $408,400 | $203,000 | $205,400 |
| 2017 | $5,516 | $389,300 | $193,400 | $195,900 |
| 2016 | $5,405 | $376,400 | $184,100 | $192,300 |
| 2015 | $5,165 | $353,800 | $184,100 | $169,700 |
| 2014 | $4,819 | $324,300 | $175,400 | $148,900 |
Map
- 111 Greenleaf St
- 168 Furnace Brook Pkwy
- 44 Greenleaf St
- 10 Edgemere Rd
- 1025 Hancock St Unit 4J
- 1025 Hancock St Unit 14F
- 1025 Hancock St Unit 2P
- 1 Adams St Unit 401
- 77 Adams St Unit 210
- 77 Adams St Unit 611
- 77 Adams St Unit 610
- 77 Adams St Unit 1102
- 999 Hancock St Unit 313
- 105 Sea St Unit 302
- 105 Sea St Unit 101
- 105 Sea St Unit 104
- 1343 Quincy Shore Dr
- 45 Oval Rd Unit 34
- 45 Oval Rd Unit 8
- 148 Presidents Ln Unit 4
- 121 Merrymount Rd
- 121 Merrymount Rd Unit 1
- 125 Merrymount Rd
- 127 Merrymount Rd
- 117 Merrymount Rd
- 117 Merrymount Rd Unit 1
- 129 Merrymount Rd
- 128 Merrymount Rd
- 124 Merrymount Rd
- 115 Merrymount Rd
- 113 Merrymount Rd
- 113 Merrymount Rd Unit 2
- 283 Southern Artery
- 283 Southern Artery
- 265 Southern Artery
- 118 Merrymount Rd
- 287 Southern Artery
- 107 Merrymount Rd Unit 2
- 107 Merrymount Rd Unit 2/F
- 107 Merrymount Rd Unit 107
Ask me questions while you tour the home.