10 Duncan St Millburn, NJ 07041
Estimated Value: $1,496,000 - $1,861,000
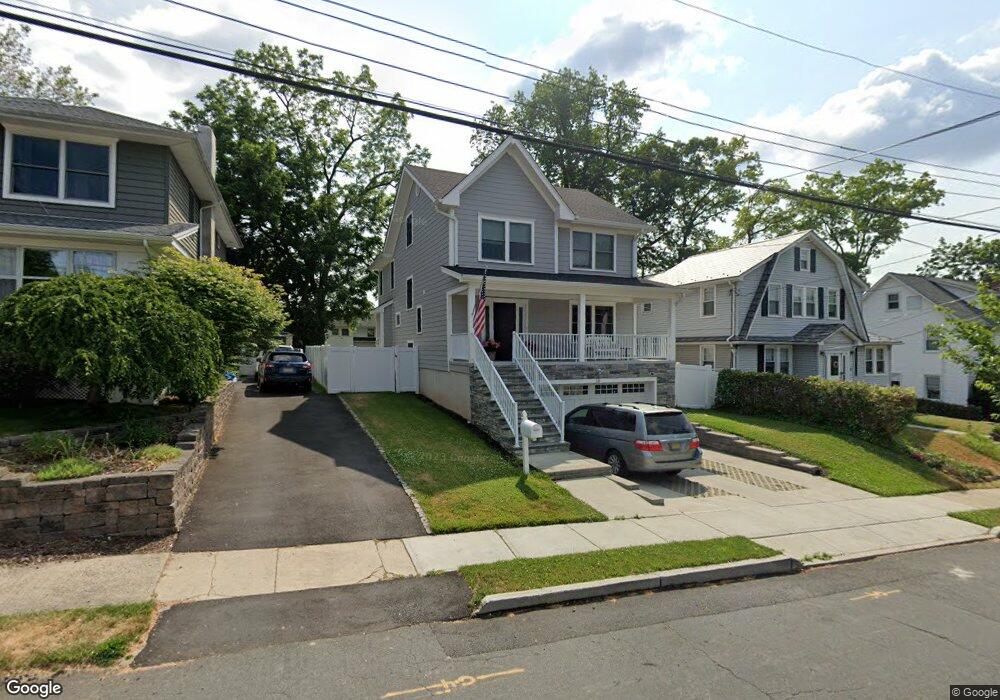
About This Home
This home is located at 10 Duncan St, Millburn, NJ 07041 and is currently estimated at $1,675,513, approximately $1,114 per square foot. 10 Duncan St is a home located in Essex County with nearby schools including South Mountain School, Millburn Middle School, and Millburn High School.
Ownership History
We collect this data history from publicly available records. To have your information removed, we recommend requesting removal directly through your county’s website.
Purchase Details
Home Financials for this Owner
Home Financials are based on the most recent Mortgage that was taken out on this home.Purchase Details
Home Financials for this Owner
Home Financials are based on the most recent Mortgage that was taken out on this home.Purchase Details
Home Values in the Area
Average Home Value in this Area
Purchase History
We collect this data history from publicly available records. To have your information removed, we recommend requesting removal directly through your county’s website.
| Date | Buyer | Sale Price | Title Company |
|---|---|---|---|
| $135,000 | North Bergen Title Agcy Inc | ||
| $170,500 | -- | ||
| -- | -- |
Mortgage History
We collect this data history from publicly available records. To have your information removed, we recommend requesting removal directly through your county’s website.
| Date | Status | Borrower | Loan Amount |
|---|---|---|---|
| Open | $1,215,000 | ||
| Previous Owner | $174,000 |
Tax History
We collect this data history from publicly available records. To have your information removed, we recommend requesting removal directly through your county’s website.
| Year | Tax Paid | Tax Assessment Tax Assessment Total Assessment is a certain percentage of the fair market value that is determined by local assessors to be the total taxable value of land and additions on the property. | Land | Improvement |
|---|---|---|---|---|
| 2025 | $24,884 | $1,255,500 | $474,600 | $780,900 |
| 2024 | $24,558 | $1,255,500 | $474,600 | $780,900 |
| 2022 | $24,394 | $1,255,500 | $474,600 | $780,900 |
| 2021 | $24,332 | $1,255,500 | $474,600 | $780,900 |
| 2020 | $10,104 | $524,600 | $474,600 | $50,000 |
| 2019 | $9,160 | $474,600 | $474,600 | $0 |
| 2018 | $11,390 | $612,000 | $474,600 | $137,400 |
| 2017 | $11,109 | $612,000 | $474,600 | $137,400 |
| 2016 | $8,622 | $411,900 | $232,200 | $179,700 |
| 2015 | $8,421 | $411,900 | $232,200 | $179,700 |
| 2014 | $8,054 | $411,900 | $232,200 | $179,700 |
Map
- 426 Millburn Ave Unit A
- 23 Blaine St
- 29 Blaine St Unit B
- 29 Blaine St
- 11 Hawthorne Rd
- 85 Whitney Rd
- 16 Old Short Hills Rd
- 5 Brookside Dr
- 24 Meeker Place
- 34 Pine Terrace E
- 27 Willow St Unit A
- 27 Willow St
- 106 Short Hills Ave
- 119 Wellington Ave
- 45 Ocean St Unit B
- 27 Hillside Ave
- 9 Overlook Terrace
- 30 Glenwood Dr
- 76 Meadowbrook Rd
- 62 Southern Slope Dr
Ask me questions while you tour the home.