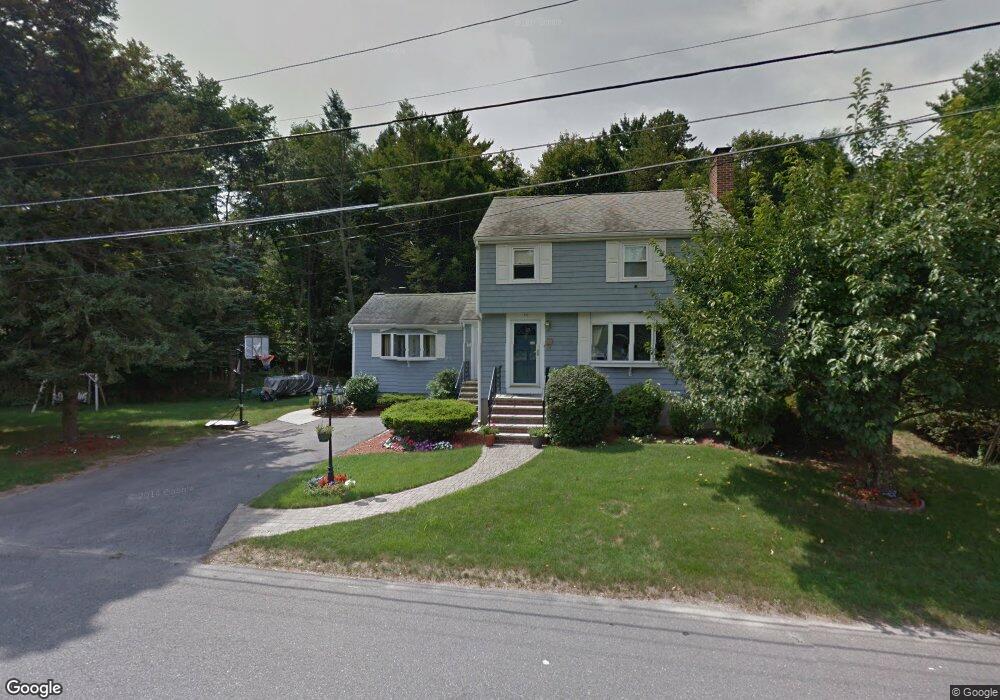
10 Erickson St Stoneham, MA 02180
Lindenwood NeighborhoodEstimated Value: $832,000 - $877,000
3
Beds
2
Baths
1,882
Sq Ft
$457/Sq Ft
Est. Value
About This Home
This home is located at 10 Erickson St, Stoneham, MA 02180 and is currently estimated at $859,211, approximately $456 per square foot. 10 Erickson St is a home located in Middlesex County with nearby schools including Stoneham High School, St. Patrick Elementary School, and St Joseph School.
Ownership History
Date
Name
Owned For
Owner Type
Purchase Details
Closed on
Aug 15, 1990
Sold by
Stefaniak Joseph L
Bought by
Ciulla Anthony T
Current Estimated Value
Home Financials for this Owner
Home Financials are based on the most recent Mortgage that was taken out on this home.
Original Mortgage
$153,750
Interest Rate
9.96%
Mortgage Type
Purchase Money Mortgage
Create a Home Valuation Report for This Property
The Home Valuation Report is an in-depth analysis detailing your home's value as well as a comparison with similar homes in the area
Home Values in the Area
Average Home Value in this Area
Purchase History
| Date | Buyer | Sale Price | Title Company |
|---|---|---|---|
| Ciulla Anthony T | $205,000 | -- |
Source: Public Records
Mortgage History
| Date | Status | Borrower | Loan Amount |
|---|---|---|---|
| Closed | Ciulla Anthony T | $158,000 | |
| Closed | Ciulla Anthony T | $153,750 | |
| Previous Owner | Ciulla Anthony T | $50,000 |
Source: Public Records
Tax History
| Year | Tax Paid | Tax Assessment Tax Assessment Total Assessment is a certain percentage of the fair market value that is determined by local assessors to be the total taxable value of land and additions on the property. | Land | Improvement |
|---|---|---|---|---|
| 2025 | $7,689 | $751,600 | $420,100 | $331,500 |
| 2024 | $7,497 | $707,900 | $400,100 | $307,800 |
| 2023 | $7,196 | $648,300 | $360,100 | $288,200 |
| 2022 | $6,367 | $611,600 | $340,100 | $271,500 |
| 2021 | $6,368 | $588,500 | $320,100 | $268,400 |
| 2020 | $6,266 | $580,700 | $310,100 | $270,600 |
| 2019 | $6,066 | $540,600 | $290,100 | $250,500 |
| 2018 | $7,189 | $503,800 | $270,100 | $233,700 |
| 2017 | $5,888 | $475,200 | $260,100 | $215,100 |
| 2016 | $5,582 | $439,500 | $240,100 | $199,400 |
| 2015 | $5,614 | $433,200 | $240,100 | $193,100 |
| 2014 | $5,445 | $403,600 | $220,100 | $183,500 |
Source: Public Records
Map
Nearby Homes
- 57 Augustus Ct Unit 1010
- 36 Augustus Ct Unit 2012
- 84 Curtis St
- 11 Isola Ln
- 66 Main St Unit 48A
- 66 Main St Unit 47A
- 33 Old Farm Rd
- 159 Main St Unit 47C
- 159 Main St Unit 52B
- 159 Main St Unit 11B
- 62 High St Unit Lot 7
- 1 Summit Dr Unit 58
- 1 Summit Dr Unit 57
- 241 Main St Unit C3
- 269 Main St Unit 4001
- 106 Elm St
- 100 Ledgewood Dr Unit 410
- 95 Prospect St
- 295 Main St Unit 16
- 36 Pine Hill Cir
Your Personal Tour Guide
Ask me questions while you tour the home.