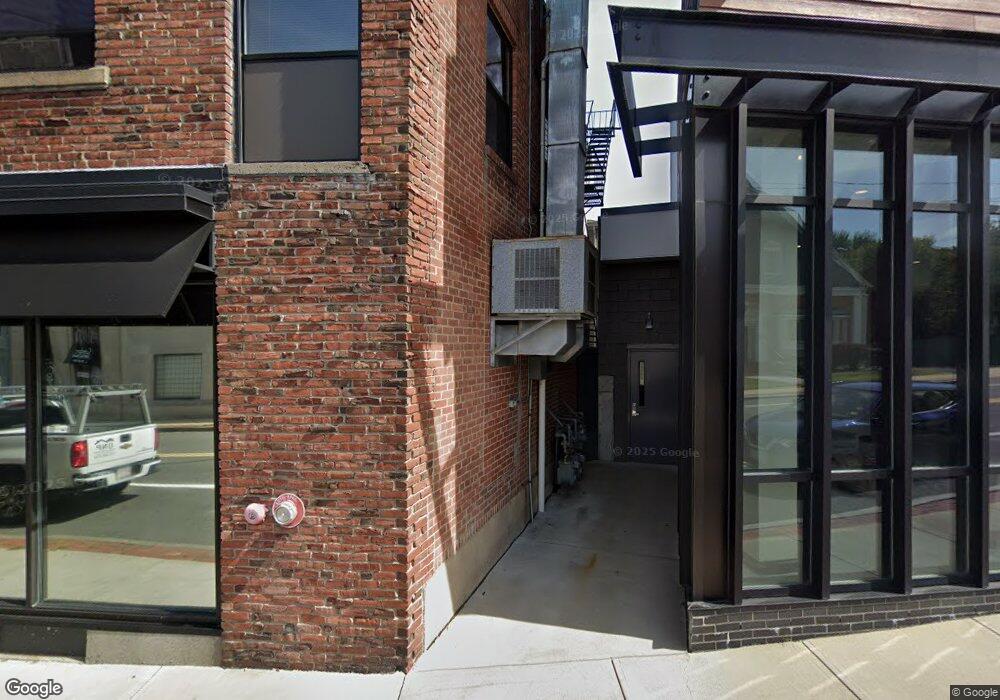
10 Front St Weymouth, MA 02188
Weymouth Landing Neighborhood
1
Bed
--
Bath
830
Sq Ft
--
Built
About This Home
10 FRONT is a new mixed-use development comprised of 23 residential apartments and 1 street-level commercial space that combines style and comfort in the heart of Weymouth Landing in Weymouth, Massachusetts. This vibrant neighborhood is home to eclectic dining, convenient shopping, and easily accessible from everywhere.
Create a Home Valuation Report for This Property
The Home Valuation Report is an in-depth analysis detailing your home's value as well as a comparison with similar homes in the area
Home Values in the Area
Average Home Value in this Area
Property History
We collect this data history from publicly available records. To have your information removed, we recommend requesting removal directly through your county’s website.
| Date | Event | Price | List to Sale | Price per Sq Ft |
|---|---|---|---|---|
| 08/15/2024 08/15/24 | Price Changed | $2,550 | +2.2% | $3 / Sq Ft |
| 07/02/2024 07/02/24 | Price Changed | $2,495 | +1.8% | $3 / Sq Ft |
| 05/02/2024 05/02/24 | Price Changed | $2,450 | +2.3% | $3 / Sq Ft |
| 03/15/2024 03/15/24 | Price Changed | $2,395 | +4.4% | $3 / Sq Ft |
| 02/14/2024 02/14/24 | Price Changed | $2,295 | -8.0% | $3 / Sq Ft |
| 01/04/2024 01/04/24 | Price Changed | $2,495 | -3.9% | $3 / Sq Ft |
| 12/02/2023 12/02/23 | Price Changed | $2,595 | +4.0% | $3 / Sq Ft |
| 10/11/2023 10/11/23 | Price Changed | $2,495 | +1.8% | $3 / Sq Ft |
| 09/08/2023 09/08/23 | Price Changed | $2,450 | -9.1% | $3 / Sq Ft |
| 08/07/2023 08/07/23 | For Rent | $2,695 | 0.0% | -- |
| 07/13/2023 07/13/23 | For Rent | $2,695 | 0.0% | -- |
| 06/16/2023 06/16/23 | For Rent | $2,695 | 0.0% | -- |
| 04/22/2023 04/22/23 | Price Changed | $2,695 | +8.0% | $3 / Sq Ft |
| 03/10/2023 03/10/23 | Price Changed | $2,495 | +1.8% | $3 / Sq Ft |
| 10/06/2022 10/06/22 | Price Changed | $2,450 | -9.3% | $3 / Sq Ft |
| 09/01/2022 09/01/22 | Price Changed | $2,700 | +28.6% | $3 / Sq Ft |
| 06/07/2022 06/07/22 | For Rent | $2,100 | 0.0% | -- |
| 05/18/2022 05/18/22 | For Rent | $2,100 | -- | -- |
Tax History
We collect this data history from publicly available records. To have your information removed, we recommend requesting removal directly through your county’s website.
| Year | Tax Paid | Tax Assessment Tax Assessment Total Assessment is a certain percentage of the fair market value that is determined by local assessors to be the total taxable value of land and additions on the property. | Land | Improvement |
|---|---|---|---|---|
| 2025 | $76,446 | $7,568,900 | $1,031,900 | $6,537,000 |
| 2024 | $79,665 | $7,757,100 | $1,092,000 | $6,665,100 |
| 2023 | $75,841 | $7,257,500 | $1,050,000 | $6,207,500 |
| 2022 | $65,762 | $5,738,400 | $966,000 | $4,772,400 |
| 2021 | $49,205 | $4,191,200 | $924,000 | $3,267,200 |
| 2020 | $23,710 | $1,989,100 | $882,000 | $1,107,100 |
| 2019 | $3,265 | $171,400 | $163,600 | $7,800 |
| 2018 | $1,166 | $59,300 | $59,300 | $0 |
| 2017 | $1,164 | $57,600 | $57,600 | $0 |
| 2016 | $1,169 | $55,400 | $55,400 | $0 |
| 2015 | $1,232 | $55,400 | $55,400 | $0 |
| 2014 | $1,183 | $54,500 | $54,500 | $0 |
Source: Public Records
Map
Nearby Homes
- 67 Washington St
- 11 Brookside Rd Unit 3
- 11 Brookside Rd Unit 6
- 12 Franklin St
- 61 Broad St
- 37 Lantern Ln
- 41 Lantern Ln
- 153 Commercial St Unit 5
- 19 Common St
- 51 Faxon St
- 40 Kingman St
- 42 Kensington Rd
- 80 Kensington Rd
- 296 Commercial St Unit 21
- 43 Harding Ave
- 16 Cotton Ave
- 7 Somerville Ave
- 45 Presidents Rd
- 83 Wilson Ave
- 40 Bell Rd
- 67 Washington St Unit 1
- 67 Washington St Unit 3
- 71 Washington St
- 63 Washington St
- 73 Washington St Unit 2
- 73 Washington St Unit 75
- 61 Washington St Unit 1
- 61 Washington St Unit 2
- 10 Front St Unit 306
- 10 Front St Unit 302
- 10 Front St Unit 407
- 10 Front St Unit 410
- 10 Front St Unit 409
- 10 Front St Unit 308
- 10 Front St Unit 310
- 10 Front St Unit 303
- 10 Front St Unit 402
- 10 Front St Unit 405
- 10 Front St Unit 403
- 10 Front St Unit 408
Your Personal Tour Guide
Ask me questions while you tour the home.